

 December 28th, 2013
  Riffin
 The widespread mass extinctions at the end of the Cretaceous caused world-wide disruption of ecosystems, and faunal responses to the one-two punch of severe environmental perturbation and ecosystem collapse are still unclear. Here we report the discovery of in situ terrestrial fossil burrows from just above the impact-defined Cretaceous-Paleogene (K/Pg) boundary in southwestern North Dakota. The crisscrossing networks of horizontal burrows occur at the interface of a lignitic coal and silty sandstone, and reveal intense faunal activity within centimeters of the boundary clay. Estimated rates of sedimentation and coal formation suggest that the burrows were made less than ten thousand years after the end-Cretaceous impact. The burrow characteristics are most consistent with burrows of extant earthworms. Moreover, the burrowing and detritivorous habits of these annelids fit models that predict the trophic and sheltering lifestyles of terrestrial animals that survived the K/Pg extinction event. In turn, such detritus-eaters would have played a critical role in supporting secondary consumers. Thus, some of the carnivorous vertebrates that radiated after the K/Pg extinction may owe their evolutionary success to thriving populations of earthworms.
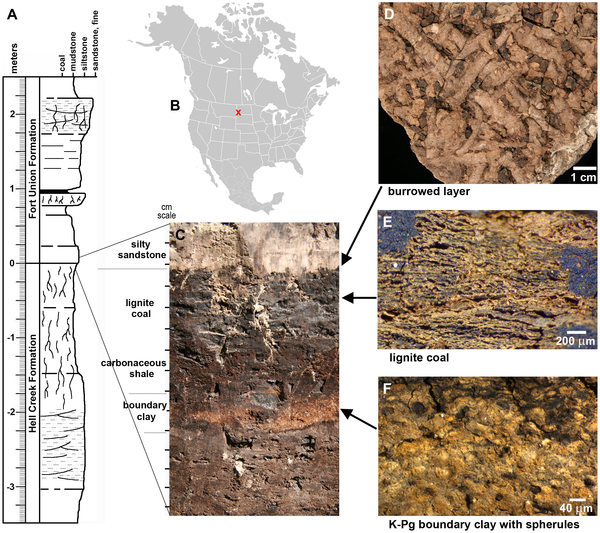
Figure 1. Terrestrial K/Pg boundary site at Mud Buttes, North Dakota.
(A) Stratigraphic section through K/Pg boundary interval; this section is located ~150 m southwest of the Mud Buttes burrow locality (adapted from Bercovici et al. 2009). (B) X marks location of Mud Buttes locality in southwestern North Dakota, USA. (C) View of K/Pg boundary in situ at Mud Buttes burrow locality. Note that burrow layer is ~6 cm above the orange-hued boundary clay at this site. Tic marks at left are in 1 cm increments. (D) Plan view of the undersides of burrows at lignite/silty sandstone interface (specimen KT4/UCM 98213). (E) Close-up of lignitic coal showing poorly-compacted plant debris. (F) Close-up of boundary clay showing abundant spherules ~40 µm in diameter.
doi:10.1371/journal.pone.0070920.g001
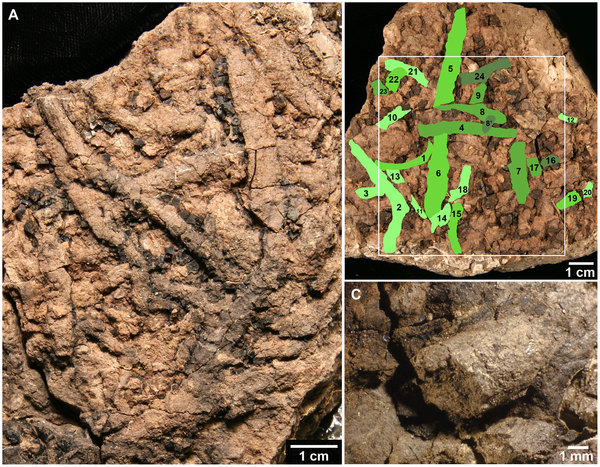
Figure 2. Planolites isp. burrows from Mud Buttes.
(A) Plan view showing undersides of closely packed horizontal burrows at coal/silty sandstone interface. Note coal still adherent to some burrows (specimen KT3/UCM 98212). (B) Discernible burrows colored and numbered to illustrate minimum burrow density within 8 cm2 (specimen KT4/UCM 98213). Portions of at least 23 burrows comprise roughly 30% of area of white box. Burrows are colored different shades of green to illustrate overlapping relationships. The burrowing activity likely took place within a short period of time, but burrows colored darker green were lower in the soil profile and appear to have been crossed in situ by other burrows (lighter shades of green). Burrows colored lightest green were the topmost burrows. Note that this specimen is the same as that in Figure 1D. (C) Close-up of burrow 19 in B (specimen KT4/UCM 98213).
doi:10.1371/journal.pone.0070920.g002
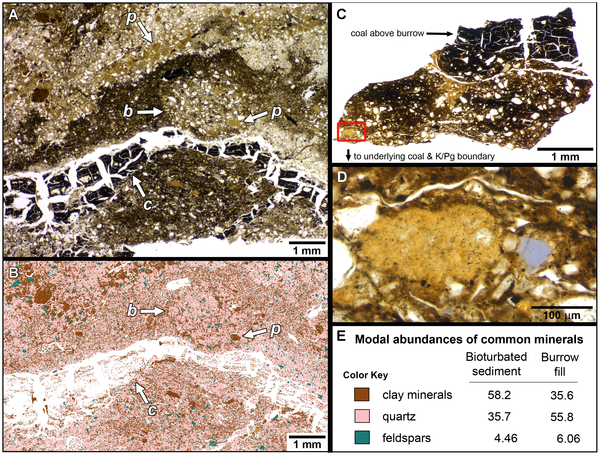
3. Thin sections of bioturbated sediment (A, B) and a section of burrow fill (C, D).
(A) Photomicrograph of thin section of epoxy-impregnated bioturbated layer (specimen KT3-T2b/UCM 98212). Bottom of photo is at the coal/silty sandstone interface, and top is several mm higher in section. The ~3 mm diameter circular structure labeled “b” in the center of the photograph appears to be a cross section of a burrow. A thin layer of fractured coal is evident below this (“c”). Numerous pelletoid blebs are visible, including one in the burrow cross-section, and several others massed together in the upper part of the photo (two are labeled “p”). (B) QEMSCAN (Quantitative Evaluation of Minerals by SCANning electron microscopy) image of portion of thin section in A showing distribution of clay minerals (brown), quartz (pink), and feldspars (turquoise) in the bioturbated sediment (note that organic matter was not detected at the kV setting used to analyze minerals). Concentrated blebs of clay are conspicuous. Same letter designations apply as in A. (C) Thin section of partial burrow fill from KT3-T3b/UCM 98212. This burrow was sandwiched between the underlying coal and a thin layer of coal on top, indicating burrowing within the Paleocene peat. Red box in lower left shows site of photomicrograph in D. (D) Close-up of area of red-box in C showing a pelletoid clay mass containing tiny (doi:10.1371/journal.pone.0070920.g003
Citation: Chin K, Pearson D, Ekdale AA (2013) Fossil Worm Burrows Reveal Very Early Terrestrial Animal Activity and Shed Light on Trophic Resources after the End-Cretaceous Mass Extinction. PLoS ONE 8(8): e70920. doi:10.1371/journal.pone.0070920
Editor: Richard J. Butler, University of Birmingham, United Kingdom
 Posted in
  Tags:
Tags: 