

 July 7th, 2017
  Riffin
 @WFS,World Fossil Society,Riffin T Sajeev,Russel T Sajeev
Climate evolution shows some regularities, which can be traced throughout long periods of earth’s history. One of them is that the global average temperature and the carbon dioxide concentration in the atmosphere usually go hand-in-hand. To put it simple: If the temperatures decline, the CO2values also decrease and vice versa.
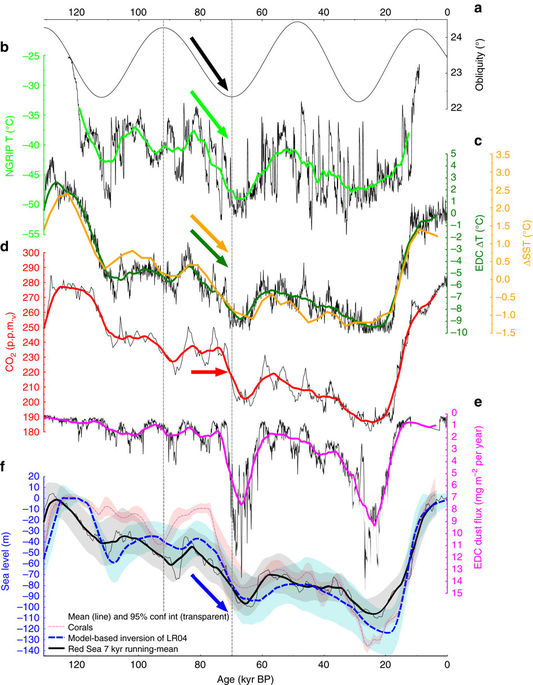
(a) Earth’s axial tilt (obliquity)66. (b) Calculated temperatures from the NGRIP ice core in Greenland on modelled chronology ‘ss09sea09bm’ with 10 years time steps67. (c) ΔT of EPICA Dome C in Antarctica68 on AICC2012 chronology69 (black line) and a recent stack of global sea surface temperature (SST) changes70 (orange line). (d) Atmospheric CO2 from the most recent CO2 stack on individual age models39. (e) Dust fluxes to EPICA Dome C37 on AICC2012 chronology. (f) Estimates of sea level changes. Solid black line with grey band is a Red Sea data-based 95% probability envelope15. Dashed blue line with cyan band: ice sheet-based deconvolution of a deep ocean benthic δ18O stack with 2 sigma uncertainty range16. Light red band: Monte-Carlo-based 95% probability to meet a compilation of U/Th-dated corals17 with own calculated mean (dark red broken line). Vertical dashed lines mark the decreasing phase in obliquity around the MIS 5/4 boundary, and coloured arrows highlight where atmospheric CO2 is apparently decoupled from long-term trends in temperatures. Antarctic ice core time series are interpolated to time steps of 100 years. The thick coloured lines in all subplots show 7 kyr running means to highlight the long-term orbitally driven changes. The time series based on global stacks of δ18O (ΔSST) and ice sheet simulation-based sea level (cyan band in f) contain only the orbital-driven signals and are therefore shown as published (without filtering).
However, there are exceptions. An international team of scientists led by the GEOMAR Helmholtz Centre for Ocean Research Kiel and the Alfred-Wegener-Institute Helmholtz Centre for Polar and Marine Research has now discovered a possible cause for such irregularities. An example is the last transition to glacial conditions. At approximately 80,000 years ago the temperatures declined, but the amount of carbon dioxide in the atmosphere remained relatively stable for several thousand years. The reason for this could be enhanced volcanic activity in the oceans induced by a falling sea level. The study is being published today in the journal Nature Communications.
During the development of glacial conditions temperatures decrease and ice sheets form, resulting in the redistribution of water from the ocean to continental regions. Thus, the sea level falls and the pressure on the on the seabed and thereby in the earth’s crust decreases, which enhances magma production.
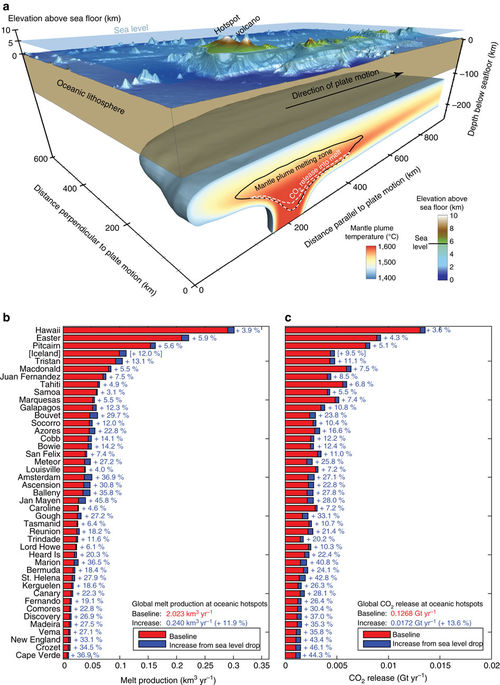
In (a) an example simulation for the Hawaiian plume (isosurface at T=1,420 °C) is shown. The magmatic system at depth extends beyond the plume stem and is susceptible to sea level changes. Size and shape of the melting region not only depend on the plume’s strength and composition but also on speed and age of the overlying lithosphere. The effect of a 60 m sea level drop over 15 kyr on magma flux (b) and CO2 release (c) is shown for the 43 oceanic hotspots investigated. Steady background values are shown in red, the increases during the MIS 5/4 sea level change in blue. Note that the melt and CO2 fluxes from the Iceland hotspot are only considered in the baseline but not in the calculation of the increase in response to a falling sea level. This has to been done to honour the observation that Iceland was glaciated during the last interglacial-glacial transition.
“To better understand and quantify these processes, we developed a comprehensive computer model that we integrated with geodynamic data. In addition to this we analyzed paleo-climate data and carried out simulations with a model of the global carbon cycle,” Dr. Jörg Hasenclever, the lead author of the study explains the approach of the team. The study investigated the response of mid-ocean ridges and of 43 ocean island volcanoes to glacial sea level changes.
“Our approach has shown that the decreasing pressure at the seafloor could have induced increased lava- and carbon dioxide emissions. The enhanced volcanic carbon dioxide flux may have stabilized the atmospheric carbon dioxide concentrations during the climate system’s descent into the last ice age,” adds Prof. Dr. Lars Rüpke of GEOMAR.

The upper panel show the different geometries of volcanic edifices supported by a viscoelastic lithosphere; the lower panel plots show the percentage of the pressure signal, induced by sea level change, that is present at 60 km depth in the asthenospheric mantle. A maximum damping of ∼25% is found for the largest island sizes. All considered hotspots were catagorized into small, medium and large island depending on their subaerial area (see Supplementary Table 2). (a) shows the results for a cone-shaped island with a maximum topography of 700 m, (b) for a medium island with 2,800 m topographic elevation, and (c) for a large island with 4,800 m elevation.
The investigations suggest that close interactions between the solid earth and the climate system exist also on geologically relatively short time scales of about 5,000 to 15,000 years. Co-author Dr. Gregor Knorr of the Alfred-Wegener-Institute further explains: “Such interactions could provide a novel component for earth system research to better understand the climate evolution at times of glacial sea level changes.”
Journal Reference:Jörg Hasenclever, Gregor Knorr, Lars H. Rüpke, Peter Köhler, Jason Morgan, Kristin Garofalo, Stephen Barker, Gerrit Lohmann, Ian R. Hall. Sea level fall during glaciation stabilized atmospheric CO2 by enhanced volcanic degassing. Nature Communications, 2017; 8: 15867 DOI: 10.1038/NCOMMS15867
Helmholtz Centre for Ocean Research Kiel (GEOMAR). “Falling sea level caused volcanoes to overflow: New connections between the solid earth and the climate system.” ScienceDaily. ScienceDaily, 6 July 2017. <www.sciencedaily.com/releases/2017/07/170706113244.htm>.
@WFS,World Fossil Society,Riffin T Sajeev,Russel T Sajeev
 Posted in
  Tags:
Tags: 