 November 19th, 2012
  riffin
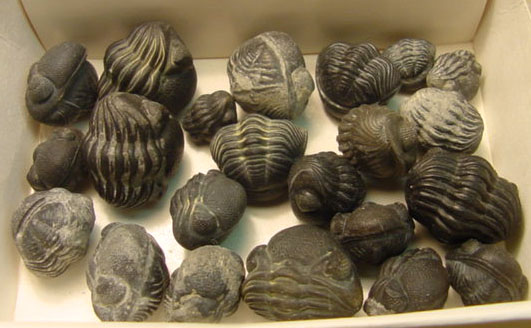
 Researchers have discovered a series of dinosaur eggs with a unique characteristic: they are oval in shape. The discovery supports the theory that birds and non-avian theropods, dinosaurs from the Cretaceous Period, could have a common ancestor.
Before her death in December 2010, Nieves López Martínez, palaeontologist of the Complutense University of Madrid, was working on the research of dinosaur eggs with a very peculiar characteristic: an ovoid, asymmetrical shape. Together with Enric Vicens, palaeontologist of the Universitat Autònoma de Barcelona, the two scientists conducted an exhaustive analysis of their discovery, recently published in the journal Palaeontology.
Researchers have discovered a series of dinosaur eggs with a unique characteristic: they are oval in shape. The discovery supports the theory that birds and non-avian theropods, dinosaurs from the Cretaceous Period, could have a common ancestor. (Credit: Image courtesy of Universitat Autònoma de Barcelona
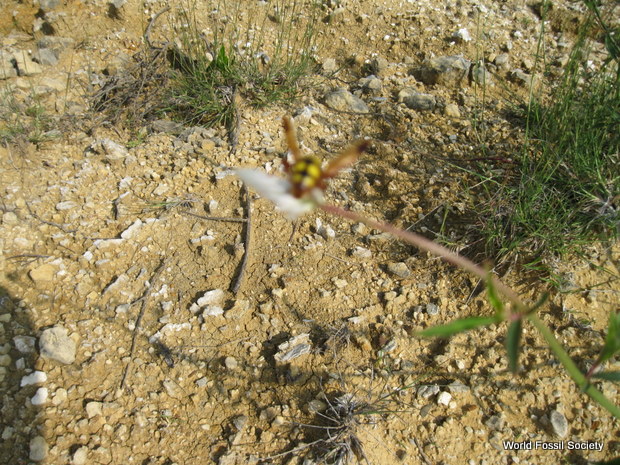
The new type of dinosaur egg has been given the scientific name ofSankofa pyrenaica. The eggs were discovered in the Montsec area of Lleida, in two sites located on either side of the Terradets pass in Spain.
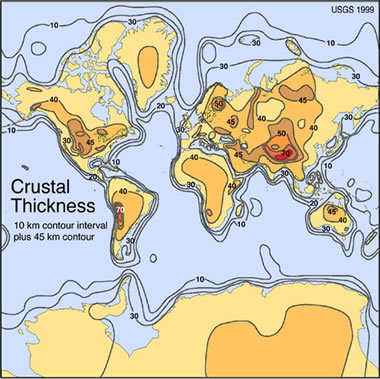
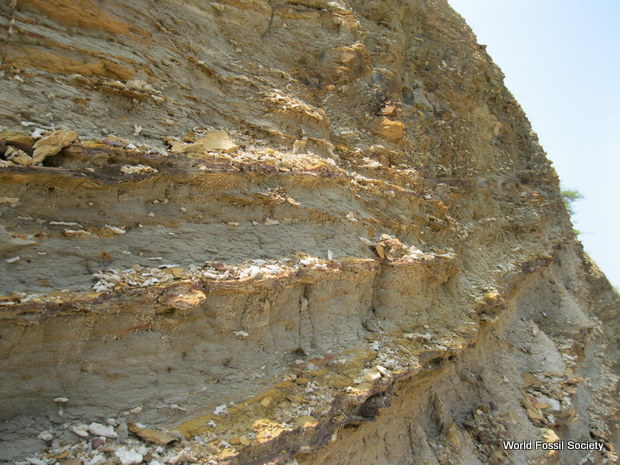
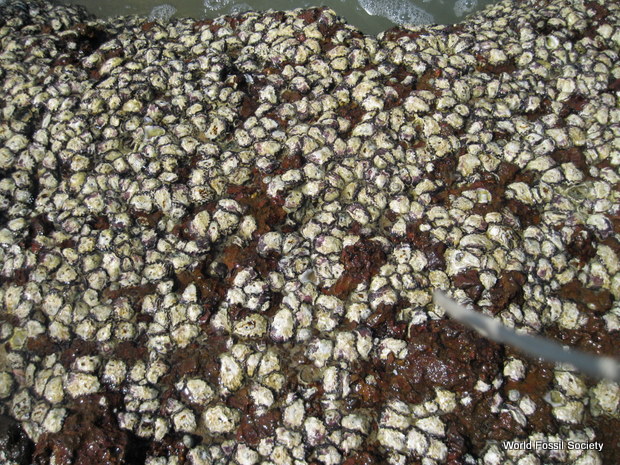
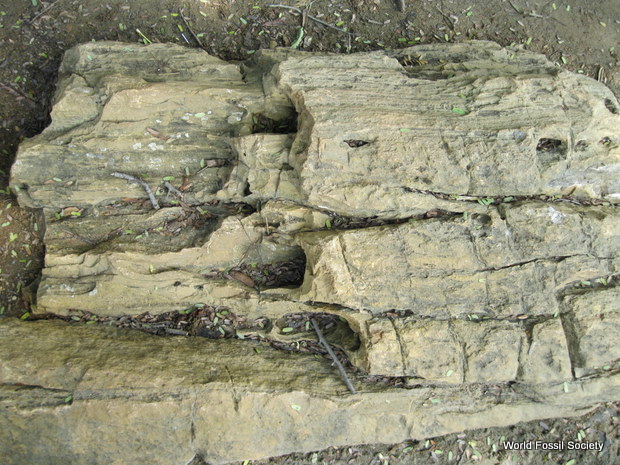
The South Pyrenean area is rich in dinosaur egg sites, most of which correspond to sauropod eggs from the upper Cretaceous, dating back more than 70 million years ago. During that period, the area was a coastal area full of beaches and deltas which won land from the sea through sediment accumulation. Sand and mud from that period gave way, millions of years later, to the sandstone and marl where dinosaur remains now can be found. On the beach ridges and flat coastal lands is where a large group of dinosaurs laid their eggs.
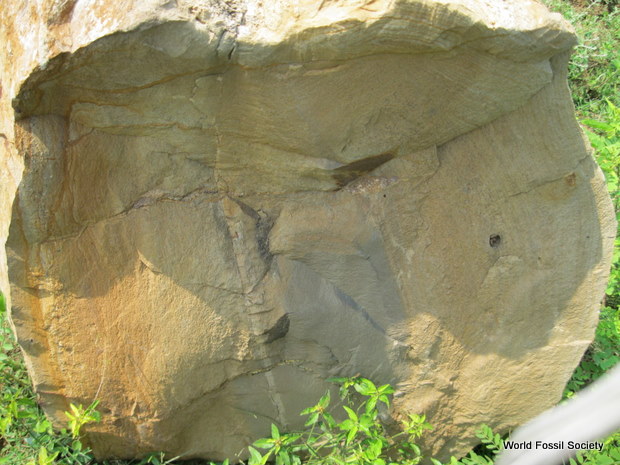
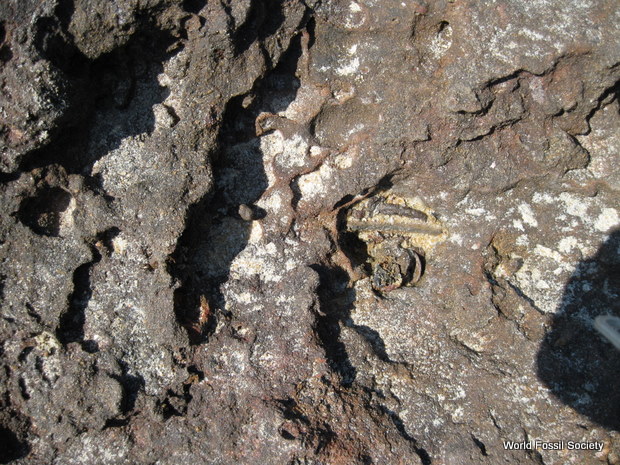
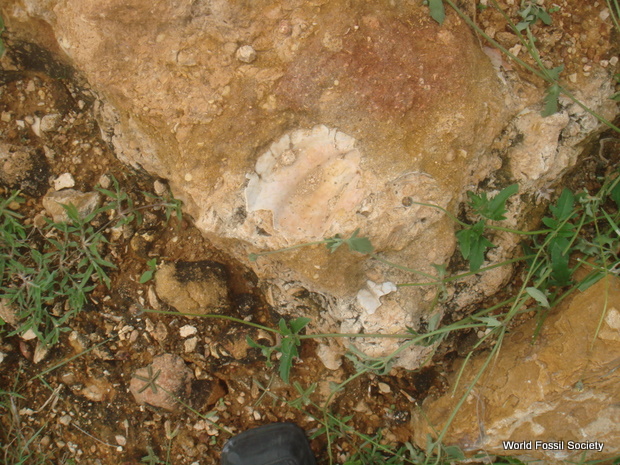
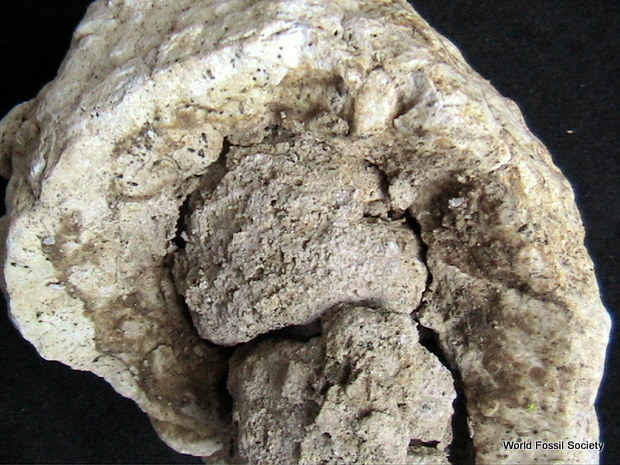
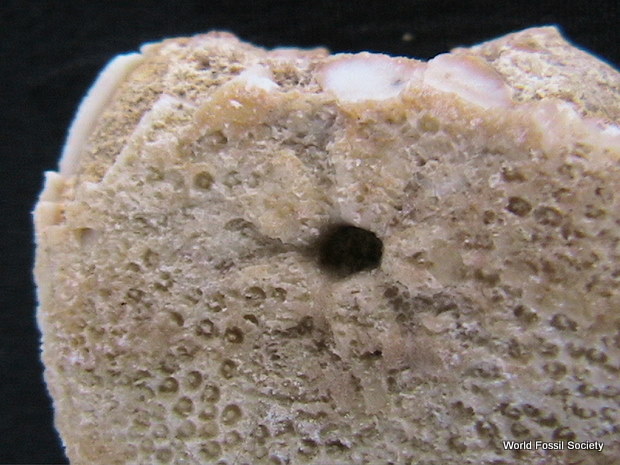
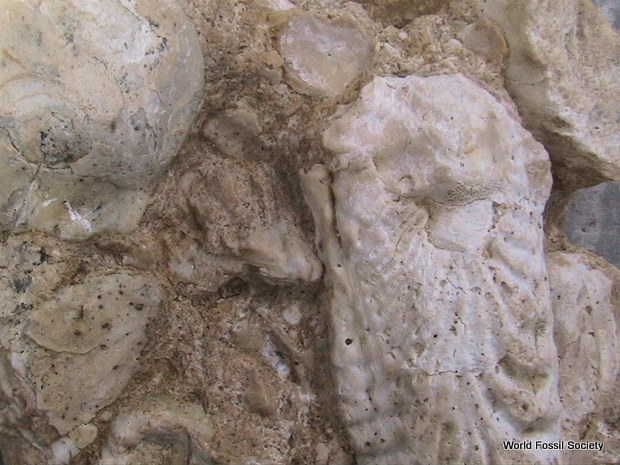
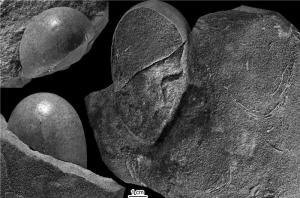
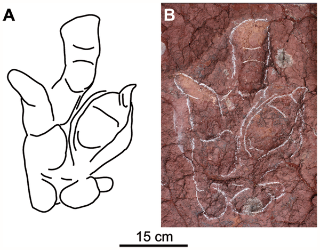
The sites where the discoveries were made correspond to the upper Cretaceous, between the Campanian and Maastrichtian periods, some 70 to 83 million years ago. The fossils found belong to small eggs measuring some 7 centimeters tall and 4 cm wide, while the eggshell was on average 0.27mm thick. Most of the eggs found were broken in small fragments, but scientists also discovered more or less complete eggs, which can be easily studied in sections. The eggs found at the sites all belong to the same species. The main difference when compared to other eggs from the same period is their asymmetrical shape, similar to that of chicken eggs. The more complete samples clearly show an oval form rarely seen in eggs from the upper Cretaceous period and similar to modern day eggs.
Their shape is a unique characteristic of theropod eggs from the upper Cretaceous period and suggests a connection with bird eggs. Non avian dinosaur eggs are symmetrical and elongated. Asymmetry in bird eggs is associated to the physiology of birds: they take on this shape given the existence of only one oviduct which can form only one egg at a time. In this case the isthmus, the region in the oviduct creating the eggshell membrane, is what gives the egg its asymmetrical shape. Thanks to this shape, the wider end contains a bag of air which allows the bird to breathe in the last stages of its development. This evolutionary step was still relatively underdeveloped in dinosaurs.
Thus, the egg discovered by UCM and UAB researchers may represent the missing link between dinosaurs and birds. Only one other egg, discovered in Argentina and corresponding to a primitive bird from the same period, has similar characteristics. The discover supports the theory that non avian theropods, the dinosaurs of the Cretaceous period, and birds could have had a common ancestor


; and dash-double-dot lines are state boundaries. The bold line shows a best-fit ellipse centered at the epicenter and passing through the observed limits (dashed where inferred beyond limits); the dotted line shows a polygon enclosing the observed landslides; the circle around the epicenter indicates the previous maximum distance limit for M 5.8 earthquake (Keefer, 1984); filled circles show maximum (1500 km2) and average (219 km2) areas expected to experience landslides for an M 5.8 earthquake based on previous studies (Keefer, 1984, 2002; Rodríguez et al., 1999). Sinuous solid line shows Blue Ridge Parkway, which extends along the crest of the Blue Ridge. Abundant susceptible slopes exist from the Blue Ridge to the west and north; few susceptible slopes are present to the south and east. (Credit: BSSA Vol. 102:6")
, from southern Alberta 78 million years ago. The new species of horned dinosaur was identified from fossils originally collected in 1958. Approximately 20 feet long and weighing more than 2 tons, the newly identified plant-eating dinosaur represents the oldest known large-bodied horned dinosaur from Canada. Research describing the new species is published in the October 2012 issue of the Canadian Journal of Earth Sciences. (Credit: © Julius T. Csotonyi 2012)")