India: Fastest Continent Because Of Thinnest Lithosphere

 India’s lithosphere is only half as thick as others which is the reason for its high speed collision with Eurasia.

Fifty million years ago the Indian sub-continent collided with the enormous Eurasian continent with a velocity of about 20 cm/year. With such a high velocity India was the fastest of the former parts of Gondwanaland, according to a report by a team of scientists from the GeoForschungsZentrum Potsdam (GFZ, Germany’s National Lab for Geosciences) and the National Geophysical Research Institute, India, in the 18th October 2007 edition of Nature.

Fifty million years ago, the Indian sub-continent collided with the enormous Eurasian continent with a velocity of about 20 cm/year. Due to this collision at such high velocities the largest mountain belt on Earth, the Himalayas, was formed. (Credit: iStockphoto/Anka Kaczmarzyk

Fifty million years ago, the Indian sub-continent collided with the enormous Eurasian continent with a velocity of about 20 cm/year. Due to this collision at such high velocities the largest mountain belt on Earth, the Himalayas, was formed. (Credit: iStockphoto/Anka Kaczmarzyk

Due to this collision at such high velocities the largest mountain belt on Earth, the Himalayas, was formed, as was the massive Tibetan plateau.

Until 140 million years ago India was part of the supercontinent Gondwanaland. When Gondwanaland broke up, its various parts drifted apart with different velocities. Today these various parts constitute India, Africa, Australia, Antarctica and South America.

However, the question which still remained to be answered was why India was quicker and moved much further than the other parts of Gondwanaland.

A new seismological method for determining the thickness of the present-day lithospheric plates with more precision than before has been developed at GFZ Potsdam. With this method the team of researchers has found that the Indian plate is only about 100 km thick, whereas the other parts of Gondwanaland are about 200 km thick and thus about twice as thick as India.

The reason for the break up of Gondwanaland was a mantle plume that heated the supercontinent from below, thereby causing it to break. This plume may have melted the lower part of the Indian sub-continent away, thus allowing India to move faster and further than the other parts.

Prehistoric “Movie Monster” Mollusk Re-created With 3-D Printer

A spiky, well-armored mollusk that lived in the ocean 390 million years ago has been brought back to life with the help of 3-D printers.

Less than an inch long, the oval-shaped creature—a species of so-called multiplacophoran dubbed Protobalanus spinicoronatus—was previously known from only a few rare and incomplete specimens, which made for inaccurate reconstructions.

Protobalanus spinicoronatus

Protobalanus spinicoronatus

“The original reconstruction was made where the plates were arranged in a long row, almost like a long worm with 17 plates down its back,” said study co-author Jakob Vinther, a paleontologist at the University of Texas at Austin.

The latest P. spinicoronatus model is based on the most complete known fossil of a multiplacophoran, discovered in 2001 in northern Ohio. Partially covered in rock, the animal’s shell and spikes had become fragmented as it decayed.

To reassemble the specimen, the team made a three-dimensional model of the broken fossil using a technology similar to medical CT scanning. They then painstakingly pieced the broken fragments of the digital fossil back together. Fossils have been digitally scanned before, Vinther said, but the new study is among the first to use the technology to reassemble a fossil that had been so badly fragmented.

The reconstruction revealed that the interlocking plates that made up the creature’s armor were actually arranged in two parallel rows, instead of one long row—the first step in re-creating what team member Esben Horn likens to a “movie monster.”

Bringing a Monster to Life

Next the team used the digitally restored copy of the fossil to create a physical model using a 3-D printer. Three-dimensional printers use computer models as guides as the machines lay down successive layers of soft material which gradually hardens.

Instead of creating a life-size version of the fossil, though, the researchers enlarged it by about 12 times, until it could be held in the palm of a hand.

Vinther says they did this to get a better feel for what the creature looked like and how its pieces fit together.

“When you have a specimen that is that small, it’s hard to get a feeling for its morphology,” or structure, he said. “With this large model, you can touch it with your fingers, and that makes a big difference.”

As a final step in bringing multiplacophoran back to life, the team sent their printout to Horn, owner of the modelmaking company 10 Tons in Copenhagen.

Esben used sculpture to create a multicolored, textured model of the creature using clay, resin, and silicon to show what the creature may have looked like millions of years ago, when it crept across the seafloor using its single, suction-like foot.

Vinther’s team had determined multiplacophorans were distant relatives of modern-day marine mollusks called chitons, so Horn used chitons as a guide when choosing colors.

“Hopefully this one can inspire a kid to see it and say, Wow, this looks like a movie monster—this is interesting. And then hopefully they can continue being paleontologists,” Esben said in a video.

Ancient Mollusk Had Many Predators?

The new model also reveals that P. spinicoronatus was more heavily armored than other mollusks living at the time, and in fact resembled some modern chitons, which live in shallow, exposed environments where there are a lot of predators—as the team believes was the case for the prehistoric mollusk too.

Multiplacophoran’s hunters would likely have included jawed fish and beaked cephalopods similar to squid and octopuses—both of which had recently evolved.

“It was a really exciting time,” Vinther said, “because there was a lot going on.”

The new mollusk model is detailed in the September 18 issue of the journal Paleontology.

Evidence of Combat in Triceratops

Images of the three-horned dinosaur Triceratops battling with conspecifics or the predatorTyrannosaurus have become ingrained in both the scientific and the popular mind. Lesions (wounded or diseased areas) on the horns, frill, and face of Triceratops specimens have been cited as evidence in support of the defensive and offensive nature of the animal’s cranial ornamentation . An alternative interpretation posits that these structures functioned in visual display rather than combat. To date, discussions of osteopathology in Triceratops have been anecdotal, focusing on generating speculative scenarios to explain instances of hypothesized injury . Without a rigorous statistical analysis, however, it is impossible to relate injury patterns to specific behaviors.

We surveyed cranial specimens from adult individuals of the ceratopsid dinosaurs Triceratops andCentrosaurus for bony lesions  . The two animals differ greatly in cranial ornamentation; Triceratops has two large supraorbital horncores and a smaller nasal horncore, whereas Centrosaurus has a large nasal horncore and a pair of small supraorbital horncores (Figure 1).

Schematics of the skulls of (A) Triceratops and (B) Centrosaurus, showing incidence rates of lesions (periosteal reactive bone and fracture calluses) on each cranial element (number of abnormal elements / total number of elements). Not to scale.

Schematics of the skulls of (A) Triceratops and (B) Centrosaurus, showing incidence rates of lesions (periosteal reactive bone and fracture calluses) on each cranial element (number of abnormal elements / total number of elements). Not to scale.

In modern horned animals, the morphology and location of the horns is closely associated with combat styles . By analogy, it is then expected that if Centrosaurus and Triceratops engaged in horned combat with conspecifics, the two genera would have had very different forms of combat. Thus, relative rates of lesion occurrence should differ between comparable cranial elements in both genera. If cranial ornamentations were used exclusively for visual display and/or species recognition, and not for physical contact, the two taxa are predicted to have similar rates of incidence for cranial lesions in all comparable cranial elements.

Results

Cranial abnormalities observed in both taxa included periosteal reactive bone, healed and healing fractures, and resorptive bone lesions of unknown etiology (Figures 2,3). Only the first two categories, considered most likely due to trauma , were included in further statistical analysis .

Figure 2. Examples of periosteal reactive bone in selected specimens of Triceratops.

Figure 2. Examples of periosteal reactive bone in selected specimens of Triceratops.

Periosteal reactive bone reflects superficial trauma; the reaction is caused by separation of the periosteum from underlying layers and subsequent inflammatory response and healing of the bone. Evidence of this injury presents as an elevated, remodeled ridge on the external surface of the bone, which may cut across the normal pattern of neurovascular impressions on the surface of the skull (Figure 2). Periosteal reactive bone was the most common of the observed pathologies (22 out of 26 observed lesions considered here).

Figure 3. Example of a fracture callus in Centrosaurus.

Figure 3. Example of a fracture callus in Centrosaurus.

Calluses associated with healed or healing fractures constitute the second variety of observed lesions (Figure 3; 4 out of 26 observed lesions). Such features result from the several steps of bone growth intended to reunify mechanically or pathologically separated pieces of bone. The process progresses from a primary callus with disorganized bone to a secondary callus of secondary bone . Because primary bone can be preserved, calluses can be discovered in different stages of healing. The character and appearance of calluses is difficult to predict as the proliferation of bone at the site can vary from minimal to extremely exuberant depending on the individual and the severity of the fracture. In the fossil record, the fractures and calluses are often associated with an overall displacement of the bone that extends for a considerable area. Typically, fractures present as a full-thickness feature in the bone with observed disturbances of the bone fabric on both the medial and lateral aspects of the bone. This contrasts with instances of periosteal reactive bone, which affect only one side of the element.

Statistical Analysis

G-test of independence was used for all comparisons . Triceratops and Centrosaurus did not differ significantly in the rates of lesion occurrence within the nasal, jugal, or parietal bones of the skull (P>0.20 in all cases;  present full data). In contrast, Triceratops had significantly higher prevalence of lesions on the squamosal bone of the frill than did Centrosaurus (P = 0.002; see Figure 1 and table S1 for full data, and Figure 3 for the sole pathological squamosal fromCentrosaurus).

Discussions

We reject the possibility that a generalized pathogenic factor (such as a habitat-specific fungal infection) caused the differing prevalence of lesions between Triceratops and Centrosaurus, because all cranial elements should then show similar rates of incidence. We also rule out predatory attacks as the primary cause of the lesions, because similar large predators (tyrannosaurid theropods) were present in the habitats for both genera, and we would thus expect similar patterns of osteological abnormalities in both. Alternatively, it might be claimed that Triceratops had more frequent occurrence of lesions on the squamosal because this element forms a greater proportion of the frill’s exposed area, and was thus more likely to be injured, than in Centrosaurus (e.g., Figure 1). We tested this hypothesis by comparing the prevalence of lesions in the entire frill of both taxa and still found a significant difference between the two (3 pathological and 84 non-pathological specimens forCentrosaurus; 10 pathological and 59 non-pathological specimens for TriceratopsP = 0.012;  for full explanation). Instead, the evidence appears to be most consistent with the majority of cranial abnormalities in Triceratops being generated by the horns of conspecifics. The observed instances of periosteal reactive bone and healing fractures are consistent with such non-random trauma, and the elevated rates of abnormal bone morphology within the frill bones are consistent with predictions from modeling of horn-to-horn combat This suggests that the cranial ornamentation of ceratopsids, particularly Triceratops, was not only for visual display but that the horns also had a real role in physical combat.

It is important to note that we do not claim to infer a precise cause for individual pathologies on certain specimens (that a slip of a horn during a specific bout caused the injury to the jugal in YPM 1822, for example; Figure 2A). Certainly, at least some of the pathologies noted here may not be due to combat. We only claim that the overall pattern in all of the specimens is consistent with intraspecific combat in Triceratops.

Non-ceratopsid neoceratopsians (e.g., Protoceratops), the evolutionary predecessors of ceratopsids, possessed a thin, enlarged frill but lacked elongated brow or nasal horns. Thus, the primitive function of the frill (in addition to a role in jaw muscle attachment) was probably that of display rather than cervical protection . The later evolution of brow horns would have increased the importance of a protective function for the frill, assuming that the horns were used in combat. The relatively thickened, solid frill of Triceratops may have been an exaptation for cervical protection, in addition to a role in display. This suggests interesting possibilities for the factors that drove the evolution of cranial morphology in ceratopsids. Display probably was an important function for the horns and frills in all ceratopsids, but not the only one. Horned combat, and the consequences of injury from this combat, may have been another important selective factor. Recent discoveries strongly suggest thatCentrosaurus evolved from an ancestor with a Triceratops-like horn configuration . One evolutionary interpretation worthy of further consideration is that some ceratopsids (such asCentrosaurus) lost their long brow horns or changed combat styles as a way to reduce cranial injury. This interpretation also suggests that the frill may not have had a protective function withinCentrosaurus (as evidenced by the reduced occurrence of lesions on the squamosal, relative toTriceratops), but instead functioned for species recognition and/or other forms of visual display.Centrosaurus and some other ceratopsids may have focused blows on an opponent’s torso rather than the skull; this is suggested by the occurrence of fractured ribs in CentrosaurusPachyrhinosaurus, and Chasmosaurus . Statistical analysis and comparison with rates of rib fracture in Triceratops, as well as rates of cranial bony anomalies in additional taxa, may be informative in further evaluating this hypothesis. Clearly, horned dinosaurs used their cranial ornamentations for a variety of functions.

Andrew A. Farke1*, Ewan D. S. Wolff2, Darren H. Tanke3

1 Raymond M. Alf Museum of Paleontology, Claremont, California, United States of America, 2 Department of Pathobiological Sciences, School of Veterinary Medicine, University of Wisconsin-Madison, Madison, Wisconsin, United States of America, 3 Royal Tyrrell Museum of Palaeontology, Drumheller, Alberta, Canada


Primitive birds shared dinosaurs’ fate

A new study puts an end to the longstanding debate about how archaic birds went extinct, suggesting they were virtually wiped out by the same meteorite impact that put an end to dinosaurs 65 million years ago.

For decades, scientists have debated whether birds from the Cretaceous period – which are very different from today’s modern bird species -died out slowly or were killed suddenly by the Chicxulub meteorite. The uncertainty was due in part to the fact that very few fossil birds from the end of this era have been discovered.

The bones are from the 17 species of Cretaceous birds which went extinct around the time of the dinosaurs. The two on the far left are foot bones and the rest are shoulder bones. - Courtesy Yale University

The bones are from the 17 species of Cretaceous birds which went extinct around the time of the dinosaurs. The two on the far left are foot bones and the rest are shoulder bones. – Courtesy Yale University

Now a team of paleontologists led by Yale researcher Nicholas Longrich has provided clear evidence that many primitive bird species survived right up until the time of the meteorite impact. They identified and dated a large collection of bird fossils representing a range of different species, many of which were alive within 300,000 years of the impact.

“This proves that these species went extinct very abruptly, in terms of geological time scales,” said Longrich. The study appears the week of Sept. 19 in the journal Proceedings of the National Academy of Sciences.

The team examined a large collection of about two dozen bird fossils discovered in North America – representing a wide range of the species that existed during the Cretaceous – from the collections of Yale’s Peabody Museum of Natural History, the American Museum of Natural History, the University of California Museum of Paleontology, and the Royal Saskatchewan Museum. Fossil birds from the Cretaceous are extremely rare, Longrich said, because bird bones are so light and fragile that they are easily damaged or swept away in streams.

“The birds that had been discovered hadn’t really been studied in a rigorous way,” Longrich said. “We took a much more detailed look at the relationships between these bones and these birds than anyone had done before.”

Longrich believes a small fraction of the Cretaceous bird species survived the impact, giving rise to today’s birds. The birds he examined showed much more diversity than had yet been seen in birds from the late Cretaceous, ranging in size from that of a starling up to a small goose. Some had long beaks full of teeth.

Yet modern birds are very different from those that existed during the late Cretaceous, Longrich said. For instance, today’s birds have developed a much wider range of specialized features and behaviors, from penguins to hummingbirds to flamingoes, while the primitive birds would have occupied a narrower range of ecological niches.

“The basic bird design was in place, but all of the specialized features developed after the mass extinction, when birds sort of re-evolved with all the diversity they display today,” Longrich said. “It’s similar to what happened with mammals after the age of the dinosaurs.”

Longrich adds that this study is not the first to suggest that archaic birds went extinct abruptly. “There’s been growing evidence that these birds were wiped out at the same time as the dinosaurs,” Longrich said. “But this new evidence effectively closes the book on the debate.”

Note: This story has been adapted from a news release issued by the Yale University

What Made the 2004 Sumatra Earthquake the Deadliest in History?

The Answser is in a Layer of Sediments

An international team of geoscientists has discovered an unusual geological formation that helps explain how an undersea earthquake off the coast of Sumatra in December 2004 spawned the deadliest tsunami in recorded history.

At a typical subduction zone, the fault ruptures primarily along the boundary between the two tectonic plates and dissipates in weak sediments (a), or ruptures along "splay faults" (b); in either case, stopping far short of the trench. In the area of the 2004 Sumatra earthquake, sediments are thicker and stronger, extending the rupture closer to the trench for a larger earthquake and, due to deeper water, a much larger tsunami. Image by: University of Texas at Austin.

At a typical subduction zone, the fault ruptures primarily along the boundary between the two tectonic plates and dissipates in weak sediments (a), or ruptures along “splay faults” (b); in either case, stopping far short of the trench. In the area of the 2004 Sumatra earthquake, sediments are thicker and stronger, extending the rupture closer to the trench for a larger earthquake and, due to deeper water, a much larger tsunami. Image by: University of Texas at Austin.

Instead of the usual weak, loose sediments typically found above the type of geologic fault that caused the earthquake, the team found a thick plateau of hard, compacted sediments. Once the fault snapped, the rupture was able to spread from tens of kilometers below the seafloor to just a few kilometers below the seafloor, much farther than weak sediments would have permitted. The extra distance allowed it to move a larger column of seawater above it, unleashing much larger tsunami waves.

Thick Sediments Might Signal Greater Hazard

“The results suggest we should be concerned about locations with large thicknesses of sediments in the trench, especially those which have built marginal plateaus,” said Sean Gulick, research scientist at The University of Texas at Austin’s Institute for Geophysics. “These may promote more seaward rupture during great earthquakes and a more significant tsunami.” The team’s results appear this week in an article lead-authored by Gulick in an advance online publication of the journal Nature Geoscience.

Visualizing Subsurface Structures

The team from The University of Texas at Austin, The University of Southampton in the United Kingdom, The Agency for the Assessment and Application of Technology in Indonesia and The Indonesia Institute for Sciences used seismic instruments, which emit sound waves, to visualize subsurface structures.

Events of December 26th, 2004

Early in the morning of Dec. 26, 2004, a powerful undersea earthquake started off the west coast of Sumatra, Indonesia. The resulting tsunami caused devastation along the coastlines bordering the Indian Ocean with tsunami waves up to 30 meters (100 feet) high inundating coastal communities. With very little warning of impending disaster, more than 230,000 people died and millions became homeless.

A Fault on the Indo-Australian – Sunda Boundary

The earthquake struck along a fault where the Indo-Australian plate is being pushed beneath the Sunda plate to the east. This is known as a subduction zone and in this case the plates meet at the Sunda Trench, around 300 kilometers west of Sumatra. The Indo-Australian plate normally moves slowly under the Sunda plate, but when the rupture occurred, it violently surged forward.

Sediments of the Sunda Trench

The Sunda Trench is full of ancient sediment, some of which has washed out of the Ganges over millions of years forming a massive accumulation of sedimentary rock called the Nicobar Fan. As the Indo-Australian plate is subducted, these sediments are scraped off to form what’s called an accretionary prism. Usually an accretionary prism slopes consistently away from the trench, but here the seabed shallows steeply before flattening out, forming a plateau.

Mechanics of Subduction Zone Earthquakes

Subduction earthquakes are thought to start tens of kilometers beneath the Earth’s surface. Displacement or “slip” on the fault, as geologists call it, propagates upwards and generally dissipates as it reaches weaker rocks closer to the surface. If it were an ordinary seismic zone, the sediment in the Sunda Trench should have slowed the upward and westward journey of the 2004 earthquake, generating a tsunami in the shallower water on the landward (east) side of the trench. But in fact the fault slip seems to have reached close to the trench, lifting large sections of the seabed in deeper water and producing a much larger tsunami.

This latest report extends work published last year in the journal Science that found a number of unusual features at the rupture zone of the 2004 earthquake such as the seabed topography, how the sediments are deformed and the locations of small earthquakes (aftershocks) following the main earthquake. The researchers also reported then that the fault zone was a much lower density zone than surrounding sediments, perhaps reducing friction and allowing a larger slip.

Climate Scientists Put Predictions to the Test

Climate-prediction models show skills in forecasting climate trends over time spans of greater than 30 years and at the geographical scale of continents, but they deteriorate when applied to shorter time frames and smaller geographical regions, a new study has found.
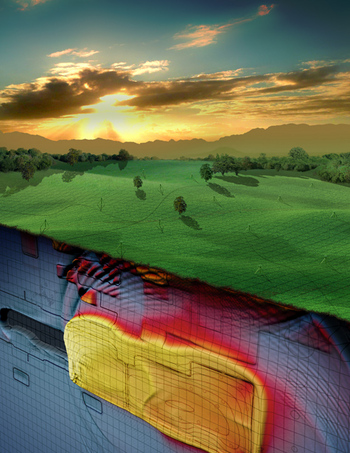
climate prediction

climate prediction

Published in the Journal of Geophysical Research-Atmospheres, the study is one of the first to systematically address a longstanding, fundamental question asked not only by climate scientists and weather forecasters, but the public as well: How good are Earth system models at predicting the surface air temperature trend at different geographical and time scales?

Xubin Zeng, a professor in the University of Arizona department of atmospheric sciences who leads a research group evaluating and developing climate models, said the goal of the study was to bridge the communities of climate scientists and weather forecasters, who sometimes disagree with respect to climate change.

According to Zeng, who directs the UA Climate Dynamics and Hydrometeorology Center, the weather forecasting community has demonstrated skill and progress in predicting the weather up to about two weeks into the future, whereas the track record has remained less clear in the climate science community tasked with identifying long-term trends for the global climate.

“Without such a track record, how can the community trust the climate projections we make for the future?” said Zeng, who serves on the Board on Atmospheric Sciences and Climate of the National Academies and the Executive Committee of the American Meteorological Society. “Our results show that actually both sides’ arguments are valid to a certain degree.”

“Climate scientists are correct because we do show that on the continental scale, and for time scales of three decades or more, climate models indeed show predictive skills. But when it comes to predicting the climate for a certain area over the next 10 or 20 years, our models can’t do it.”

To test how accurately various computer-based climate prediction models can turn data into predictions, Zeng’s group used the “hindcast” approach.

“Ideally, you would use the models to make predictions now, and then come back in say, 40 years and see how the predictions compare to the actual climate at that time,” said Zeng. “But obviously we can’t wait that long. Policymakers need information to make decisions now, which in turn will affect the climate 40 years from now.”

Zeng’s group evaluated seven computer simulation models used to compile the reports that the Intergovernmental Panel on Climate Change, or IPCC, issues every six years. The researchers fed them historical climate records and compared their results to the actual climate change observed between then and now.

“We wanted to know at what scales are the climate models the IPCC uses reliable,” said Koichi Sakaguchi, a doctoral student in Zeng’s group who led the study. “These models considered the interactions between the Earth’s surface and atmosphere in both hemispheres, across all continents and oceans and how they are coupled.”

Zeng said the study should help the community establish a track record whose accuracy in predicting future climate trends can be assessed as more comprehensive climate data become available.

“Our goal was to provide climate modeling centers across the world with a baseline they can use every year as they go forward,” Zeng added. “It is important to keep in mind that we talk about climate hindcast starting from 1880. Today, we have much more observational data. If you start your prediction from today for the next 30 years, you might have a higher prediction skill, even though that hasn’t been proven yet.”

The skill of a climate model depends on three criteria at a minimum, Zeng explained. The model has to use reliable data, its prediction must be better than a prediction based on chance, and its prediction must be closer to reality than a prediction that only considers the internal climate variability of the Earth system and ignores processes such as variations in solar activity, volcanic eruptions, greenhouse gas emissions from fossil fuel burning and land-use change, for example urbanization and deforestation.

“If a model doesn’t meet those three criteria, it can still predict something but it cannot claim to have skill,” Zeng said.

According to Zeng, global temperatures have increased in the past century by about 1.4 degrees Fahrenheit or 0.8 degrees Celsius on average. Barring any efforts to curb global warming from greenhouse gas emissions, the temperatures could further increase by about 4.5 degrees Fahrenheit (2.5 degrees Celsius) or more by the end of the 21st century based on these climate models.

“The scientific community is pushing policymakers to avoid the increase of temperatures by more than 2 degrees Celsius because we feel that once this threshold is crossed, global warming could be damaging to many regions,” he said.

Zeng said that climate models represent the current understanding of the factors influencing climate, and then translate those factors into computer code and integrate their interactions into the future.

“The models include most of the things we know,” he explained, “such as wind, solar radiation, turbulence mixing in the atmosphere, clouds, precipitation and aerosols, which are tiny particles suspended in the air, surface moisture and ocean currents.”

Zeng described how the group did the analysis: “With any given model, we evaluated climate predictions from 1900 into the future — 10 years, 20 years, 30 years, 40 years, 50 years. Then we did the same starting in 1901, then 1902 and so forth, and applied statistics to the results.”

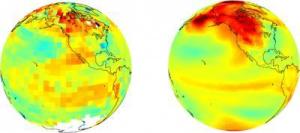
Climate models divide the Earth into grid boxes whose size determines its spatial resolution. According to Zeng, state of the art is about one degree, equaling about 60 miles (100 kilometers).

“There has to be a simplification because if you look outside the window, you realize you don’t typically have a cloud cover that measures 60 miles by 60 miles. The models cannot reflect that kind of resolution. That’s why we have all those uncertainties in climate prediction.”

“Our analysis confirmed what we expected from last IPCC report in 2007,” said Sakaguchi. “Those climate models are believed to be of good skill on large scales, for example predicting temperature trends over several decades, and we confirmed that by showing that the models work well for time spans longer than 30 years and across geographical scales spanning 30 degrees or more.”

The scientists pointed out that although the IPCC issues a new report every six years, they didn’t see much change with regard to the prediction skill of the different models.

“The IPCC process is driven by international agreements and politics,” Zeng said. “But in science, we are not expected to make major progress in just six years. We have made a lot of progress in understanding certain processes, for example airborne dust and other small particles emitted from surface, either through human activity or through natural sources into the air. But climate and the Earth system still are extremely complex. Better understanding doesn’t necessarily translate into better skill in a short time.”

“Once you go into details, you realize that for some decades, models are doing a much better job than for some other decades. That is because our models are only as good as our understanding of the natural processes, and there is a lot we don’t understand.”

Michael Brunke, a graduate student in Zeng’s group who focused on ocean-atmosphere interactions, co-authored the study, which is titled “The Hindcast Skill of the CMIP Ensembles for the Surface Air Temperature Trend.”


Prehistoric Birds Were Poor Flyers, Research Shows

The evolution of flight took longer than previously thought with the ancestors of modern birds “rubbish” at flying, if they flew at all, according to scientists.

Archaeopteryx. (Credit: Image courtesy of Todd Marshall

Archaeopteryx. (Credit: Image courtesy of Todd Marshall

Archaeopteryx, the theropod dinosaur believed to be the earliest bird, was discovered 150 years ago but debates about how flight evolved still persist. The two theories are that flight evolved in running bipeds through a series of short jumps or that Archaeopteryx leapt from tree to tree using its wings as a balancing mechanism.

Dr Robert Nudds at The University of Manchester is carrying out a series of biomechanical investigations to shed light on the subject with his colleague Dr Gareth Dyke at University College Dublin.

For their latest paper Dr Nudds and Dr Dyke applied a novel biomechanical analysis to the flight feathers of the early birdsArchaeopteryx and Confuciusornis to find out if they were strong enough to allow flight.

They found that the dinosaur feathers’ much thinner central stem (rachis) must have been solid or they would have broken under the lift forces generated during flight or by gusts of wind. This solid structure is very different to modern birds, whose rachises are broader, hollow straws. If the dinosaurs’ feathers had had hollow rachises, they would not have been able to fly at all.

“These are surprising results,” says Dr Nudds, whose findings are published in Science.

“I thought the feathers would be strong enough with a hollow rachis to fly but they weren’t. Even with a solid rachis, they were not very good. These dinosaurs were rubbish at flying.

“This pushes the origin of flapping flight to after Archaeopteryxand Confuciusornis. It must have come much later.”

It is impossible to tell from fossils whether the rachises were solid or hollow. However Dr Nudds, at Manchester’s Faculty of Life Sciences, believes the dinosaurs’ feathers were solid and therefore they could fly, but very poorly.

“The fossilsof Confuciusornis and Archaeopteryx suggest flight and at this stage it would be a brave person to say they couldn’t fly” he says.

“However their feathers must have been very different to modern birds and they were poor fliers. I believe the feathers were originally for insulation or display purposes then they found that by elongating them they had a parachuting surface, then a gliding surface.

Archaeopteryx and Confuciusornis are still at a very early stage in the evolution of flight.”

Dr Nudds’ and Dr Dykes’ work builds on their previous paper, in the journal Evolution, which investigated how the movement of feathered dinosaur forelimbs evolved into flapping flight. Again they found the flight was a consequence of gradual changes in wing shape and movement — a long, slow evolution.

Dr Nudds adds: “Our analysis also shows that Confuciusornis, which is younger by 25 million years, was worse at flying thanArchaeopteryx. This raises the further question of lineage — did the dinosaur-bird line branch off, giving rise to flying and flightless birds?”

He and Dr Dyke plan to analyse other fossilized feathers to find out when flapping flight evolved. However such specimens are rare.

“I don’t mind,” says Dr Nudds. “It makes it more exciting and all the more intriguing.”


Caltech Researchers Gain Greater Insight into Earthquake Cycles

For those who study earthquakes, one major challenge has been trying to understand all the physics of a fault—both during an earthquake and at times of “rest”—in order to know more about how a particular region may behave in the future. Now, researchers at the California Institute of Technology (Caltech) have developed the first computer model of an earthquake-producing fault segment that reproduces, in a single physical framework, the available observations of both the fault’s seismic (fast) and aseismic (slow) behavior.

modelling on the fault

modelling on the fault

“Our study describes a methodology to assimilate geologic, seismologic, and geodetic data surrounding a seismic fault to form a physical model of the cycle of earthquakes that has predictive power,” says Sylvain Barbot, a postdoctoral scholar in geology at Caltech and lead author of the study.

A paper describing their model—the result of a Caltech Tectonics Observatory (TO) collaborative study by geologists and geophysicists from the Institute’s Division of Geological and Planetary Sciences and engineers from the Division of Engineering and Applied Science—appears in the May 11 edition of the journal Science.

“Previous research has mostly either concentrated on the dynamic rupture that produces ground shaking or on the long periods between earthquakes, which are characterized by slow tectonic loading and associated slow motions—but not on both at the same time,” explains study coauthor Nadia Lapusta, professor of mechanical engineering and geophysics at Caltech. Her research group developed the numerical methods used in making the new model. “In our study, we model the entire history of an earthquake-producing fault and the interaction between the fast and slow deformation phases.”

Using previous observations and laboratory findings, the team—which also included coauthor Jean-Philippe Avouac, director of the TO—modeled an active region of the San Andreas Fault called the Parkfield segment. Located in central California, Parkfield produces magnitude-6 earthquakes every 20 years on average. They successfully created a series of earthquakes (ranging from magnitude 2 to 6) within the computer model, producing fault slip before, during, and after the earthquakes that closely matched the behavior observed in the past fifty years.

“Our model explains some aspects of the seismic cycle at Parkfield that had eluded us, such as what causes changes in the amount of time between significant earthquakes and the jump in location where earthquakes nucleate, or begin,” says Barbot.

The paper also demonstrates that a physical model of fault-slip evolution, based on laboratory experiments that measure how rock materials deform in the fault core, can explain many aspects of the earthquake cycle—and does so on a range of time scales. “Earthquake science is on the verge of building models that are based on the actual response of the rock materials as measured in the lab—models that can be tailored to reproduce a broad range of available observations for a given region,” says Lapusta. “This implies we are getting closer to understanding the physical laws that govern how earthquakes nucleate, propagate, and arrest.”

She says that they may be able to use models much like the one described in the Science paper to forecast the range of potential earthquakes on a fault segment, which could be used to further assess seismic hazard and improve building designs.

Avouac agrees. “Currently, seismic hazard studies rely on what is known about past earthquakes,” he says. “However, the relatively short recorded history may not be representative of all possibilities, especially rare extreme events. This gap can be filled with physical models that can be continuously improved as we learn more about earthquakes and laws that govern them.”

“As computational resources and methods improve, dynamic simulations of even more realistic earthquake scenarios, with full account for dynamic interactions among faults, will be possible,” adds Barbot.

The Science study, “Under the Hood of the Earthquake Machine; Toward Predictive Modeling of the Seismic Cycle,” was funded by grants from the Gordon and Betty Moore Foundation, the National Science Foundation, and the Southern California Earthquake Center.

Source: Katie Neith,Caltech Media Relations 

Giant ‘balloon of magma’ inflates under Santorini

A new survey suggests that the chamber of molten rock beneath Santorini’s volcano expanded 10-20 million cubic meters – up to 15 times the size of London’s Olympic Stadium – between January 2011 and April 2012.

The growth of this ‘balloon’ of magma has seen the surface of the island rise 8-14 centimetres during this period, a team led by Oxford University scientists has found. The results come from an expedition, funded by the UK’s Natural Environment Research Council, which used satellite radar images and Global Positioning System receivers (GPS) that can detect movements of the Earth’s surface of just a few millimetres.

Baloon of magma

Baloon of magma

The findings are helping scientists to understand more about the inner workings of the volcano which had its last major explosive eruption 3,600 years ago, burying the islands of Santorini under metres of pumice. However, it still does not provide an answer to the biggest question of all: ‘when will the volcano next erupt?’

A report of the research appears in this week’s Nature Geoscience.

In January 2011, a series of small earthquakes began beneath the islands of Santorini. Most were so small they could only be detected with sensitive seismometers but it was the first sign of activity beneath the volcano to be detected for 25 years.

Following the earthquakes Michelle Parks, an Oxford University DPhil student, spotted signs of movement of the Earth’s surface on Santorini in satellite radar images. Oxford University undergraduate students then helped researchers complete a new survey of the island.

Michelle Parks of Oxford University’s Department of Earth Sciences, an author of the paper, said: ‘During my field visits to Santorini in 2011, it became apparent that many of the locals were aware of a change in the behaviour of their volcano. The tour guides, who visit the volcano several times a day, would update me on changes in the amount of strong smelling gas being released from the summit, or changes in the colour of the water in some of the bays around the islands. On one particular day in April 2011, two guides told me they had felt an earthquake while they were on the volcano and that the motion of the ground had actually made them jump. Locals working in restaurants on the main island of Thera became aware of the increase in earthquake activity due to the vibration and clinking of glasses in their bars.’

Dr Juliet Biggs of Bristol University, also an author of the paper, said: ‘People were obviously aware that something was happening to the volcano, but it wasn’t until we saw the changes in the GPS, and the uplift on the radar images that we really knew that molten rock was being injected at such a shallow level beneath the volcano. Many volcanologists study the rocks produced by old eruptions to understand what happened in the past, so it’s exciting to use cutting-edge satellite technology to link that to what’s going on in the volcanic plumbing system right now.’

Professor David Pyle of Oxford University’s Department of Earth Sciences, an author of the paper, said: ‘For me, the challenge of this project is to understand how the information on how the volcano is behaving right now can be squared with what we thought we knew about the volcano, based on the studies of both recent and ancient eruptions. There are very few volcanoes where we have such detailed information about their past history.’

The team calculate that the amount of molten rock that has arrived beneath Santorini in the past year is the equivalent of about 10-20 years growth of the volcano. But this does not mean that an eruption is about to happen: in fact the rate of earthquake activity has dropped off in the past few months.

Note: This story has been adapted from a news release issued by the University of Oxford


Study of Giant Viruses Shakes Up Tree of Life

A new study of giant viruses supports the idea that viruses are ancient living organisms and not inanimate molecular remnants run amok, as some scientists have argued. The study may reshape the universal family tree, adding a fourth major branch to the three that most scientists agree represent the fundamental domains of life. The new findings appear in the journal BMC Evolutionary Biology.

giant Virus

giant Virus

The researchers used a relatively new method to peer into the distant past. Rather than comparing genetic sequences, which are unstable and change rapidly over time, they looked for evidence of past events in the three-dimensional, structural domains of proteins. These structural motifs, called folds, are relatively stable molecular fossils that — like the fossils of human or animal bones — offer clues to ancient evolutionary events, said University of Illinois crop sciences and Institute for Genomic Biology professor Gustavo Caetano-Anollés, who led the analysis.

“Just like paleontologists, we look at the parts of the system and how they change over time,” Caetano-Anollés said. Some protein folds appear only in one group or in a subset of organisms, he said, while others are common to all organisms studied so far.

“We make a very basic assumption that structures that appear more often and in more groups are the most ancient structures,” he said.

Most efforts to document the relatedness of all living things have left viruses out of the equation, Caetano-Anollés said.

“We’ve always been looking at the Last Universal Common Ancestor by comparing cells,” he said. “We never added viruses. So we put viruses in the mix to see where these viruses came from.”

The researchers conducted a census of all the protein folds occurring in more than 1,000 organisms representing bacteria, viruses, the microbes known as archaea, and all other living things. The researchers included giant viruses because these viruses are large and complex, with genomes that rival — and in some cases exceed — the genetic endowments of the simplest bacteria, Caetano-Anollés said.

“The giant viruses have incredible machinery that seems to be very similar to the machinery that you have in a cell,” he said. “They have complexity and we have to explain why.”

Part of that complexity includes enzymes involved in translating the genetic code into proteins, he said. Scientists were startled to find these enzymes in viruses, since viruses lack all other known protein-building machinery and must commandeer host proteins to do the work for them.

In the new study, the researchers mapped evolutionary relationships between the protein endowments of hundreds of organisms and used the information to build a new universal tree of life that included viruses. The resulting tree had four clearly differentiated branches, each representing a distinct “supergroup.” The giant viruses formed the fourth branch of the tree, alongside bacteria, archaea and eukarya (plants, animals and all other organisms with nucleated cells).

The researchers discovered that many of the most ancient protein folds — those found in most cellular organisms — were also present in the giant viruses. This suggests that these viruses appeared quite early in evolution, near the root of the tree of life, Caetano-Anollés said.

The new analysis adds to the evidence that giant viruses were originally much more complex than they are today and experienced a dramatic reduction in their genomes over time, Caetano-Anollés said. This reduction likely explains their eventual adoption of a parasitic lifestyle, he said. He and his colleagues suggest that giant viruses are more like their original ancestors than smaller viruses with pared down genomes.

The researchers also found that viruses appear to be key “spreaders of information,” Caetano-Anollés said.

“The protein structures that other organisms share with viruses have a particular quality, they are (more widely) distributed than other structures,” he said. “Each and every one of these structures is an incredible discovery in evolution. And viruses are distributing this novelty,” he said.

Most studies of giant viruses are “pointing in the same direction,” Caetano-Anollés said. “And this study offers more evidence that viruses are embedded in the fabric of life.”

The research team included graduate student Arshan Nasir; and Kyung Mo Kim, of the Korea Research Institute of Bioscience and Biotechnology.