July 16th, 2017

Riffin
@ WFS,World Fossil Society,Riffin T Sajeev,Russel T Sajeev
Using a combination of fossils and chemical markers, scientists have tracked how a period of globally low ocean-oxygen turned an Early Jurassic marine ecosystem into a stressed community inhabited by only a few species.
The research was led by Rowan Martindale, an assistant professor at The University of Texas at Austin Jackson School of Geosciences, and published in print in Palaeogeography, Palaeoclimatology, Palaeoeconology on July 15. The study was co-authored by Martin Aberhan, a curator at the Institute for Evolution and Biodiversity Science at the Natural History Museum in Berlin, Germany.
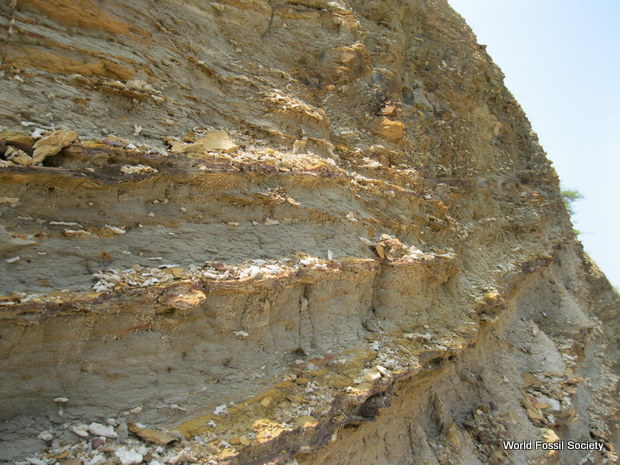
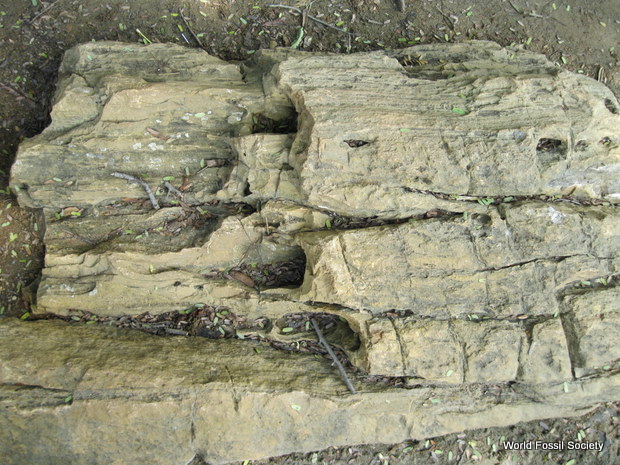
The study zeroes in on a recently discovered fossil site in Canada located at Ya Ha Tinda Ranch near Banff National Park in southwest Alberta. The site records fossils of organisms that lived about 183 million years ago during the Early Jurassic in a shallow sea that once covered the region.
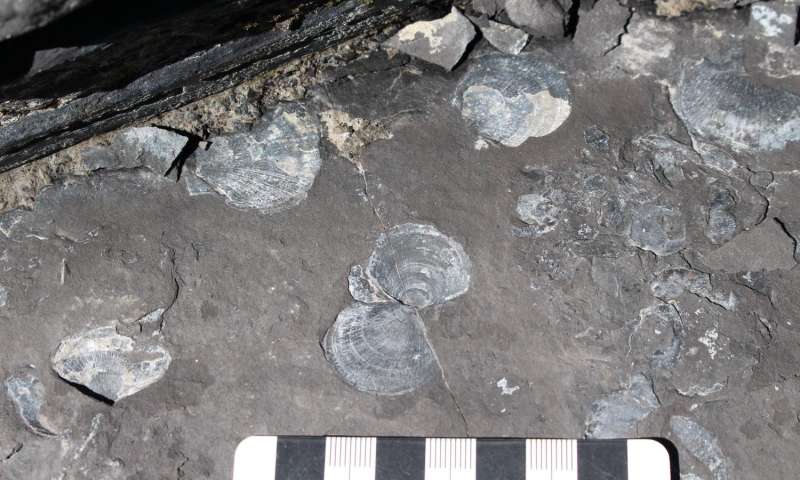
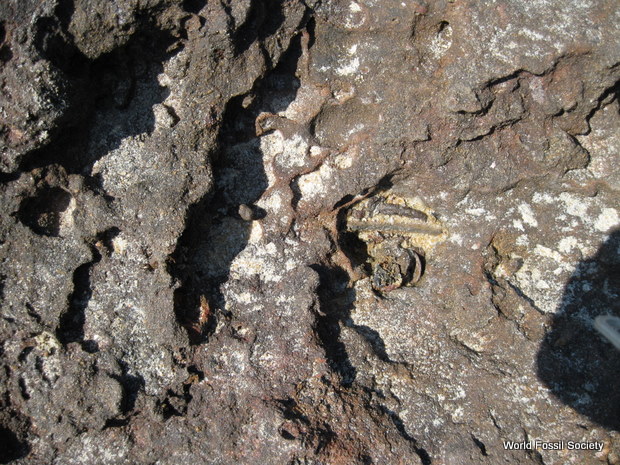
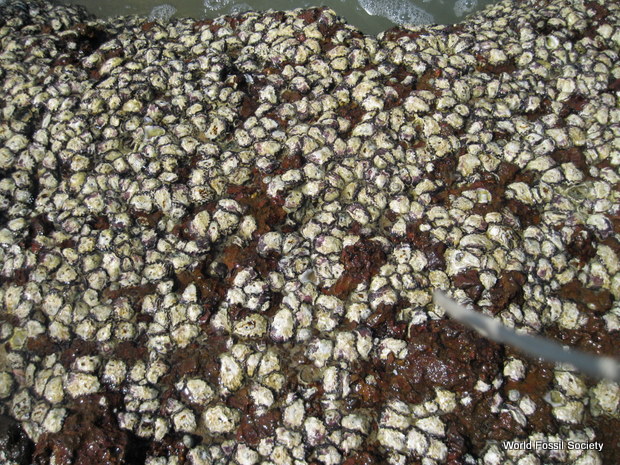
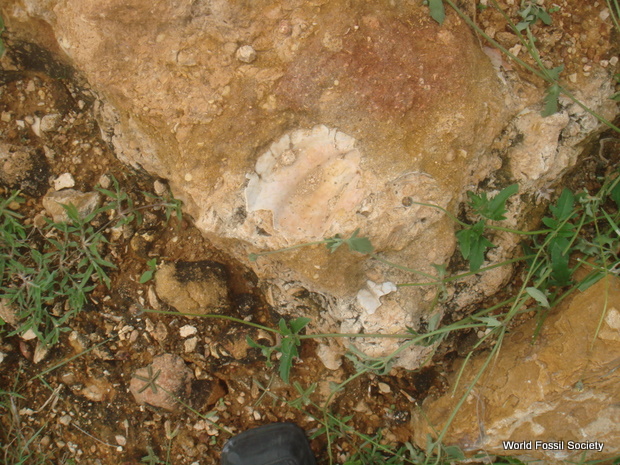
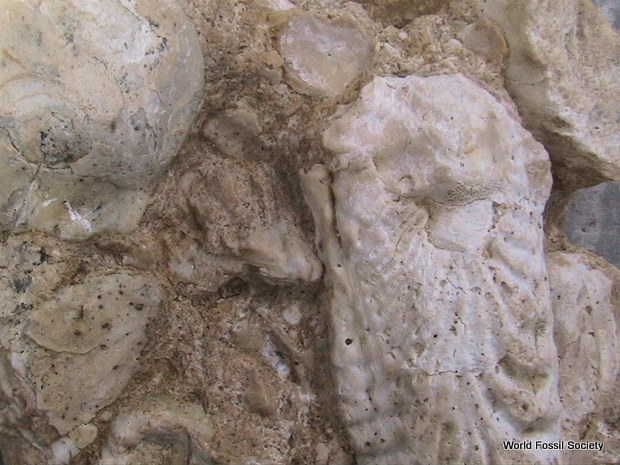
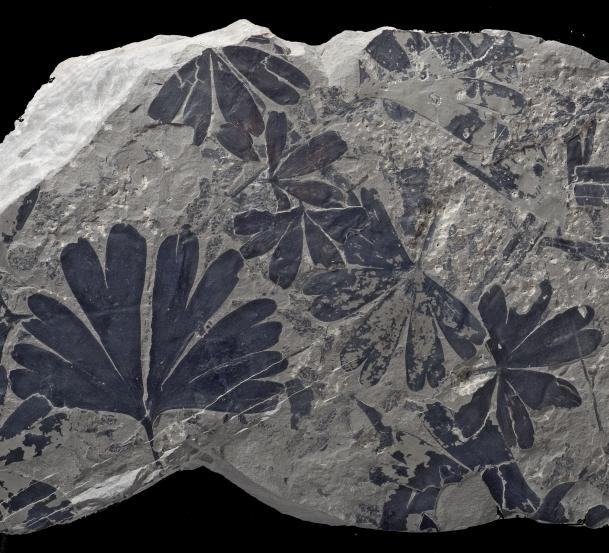
Before the low oxygen period, bivalves were larger and more numerous. Credit: The University of Texas at Austin/Rowan Martindale
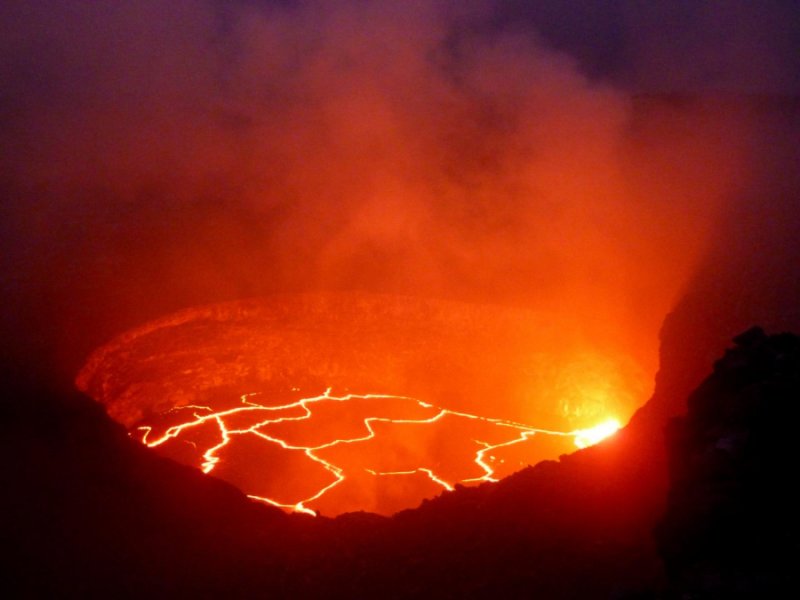
The fossil site broadens the scientific record of the Toarcian Oceanic Anoxic Event, a period of low oxygen in shallow ocean waters which is hypothesized to be triggered by massive volcanic eruptions. The Oceanic Anoxic Event was identified at this site by the geochemical record preserved in the rocks. These geochemical data were collected in a previous research project led by Benjamin Gill and Theodore Them of Virginia Tech. The oxygen level of the surrounding environment during the Early Jurassic influences the type and amount of carbon preserved in rocks, making the geochemical record an important method for tracking an anoxic event.
“We have this beautiful geochemical record that gives us a backbone for the timing of the Oceanic Anoxic Event,” said Martindale, a researcher in the Jackson School’s Department of Geological Sciences. “So with that framework we can look at the benthic community, the organisms that are living on the bottom of the ocean, and ask ‘how did this community respond to the anoxic event?”
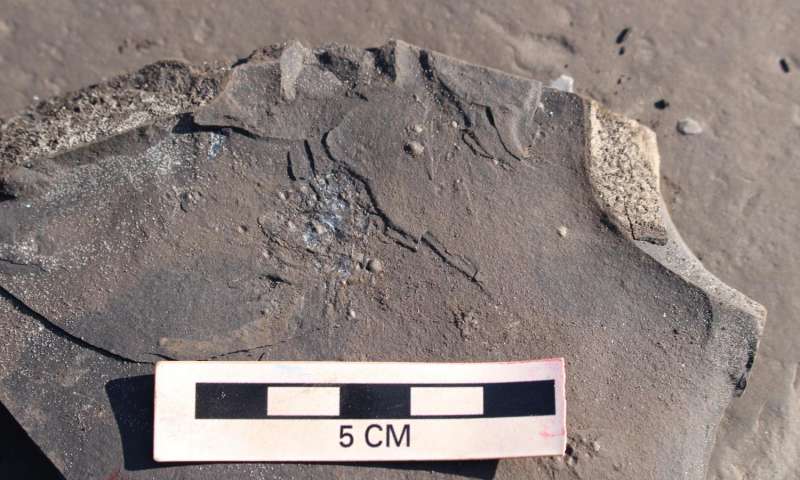
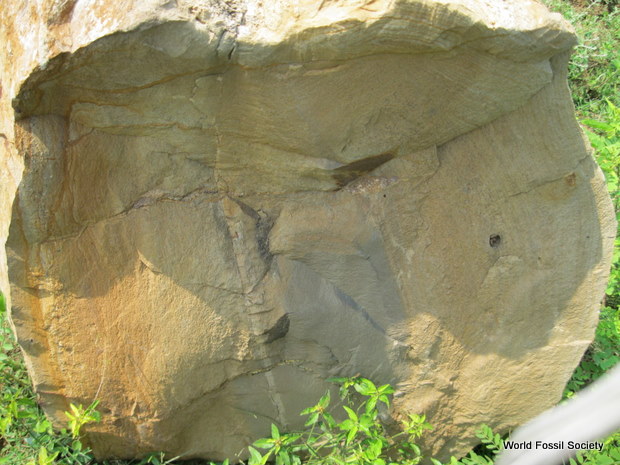
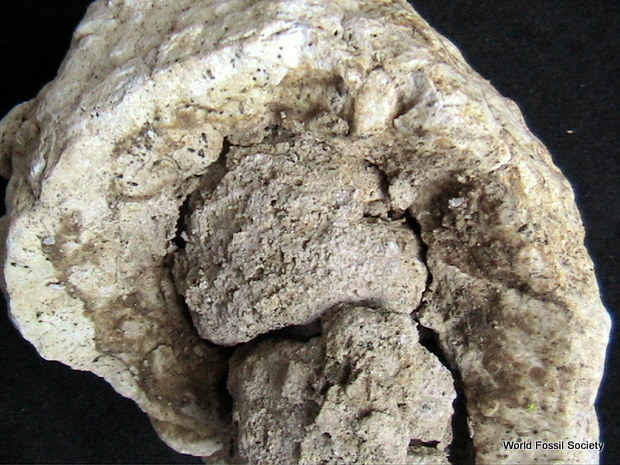
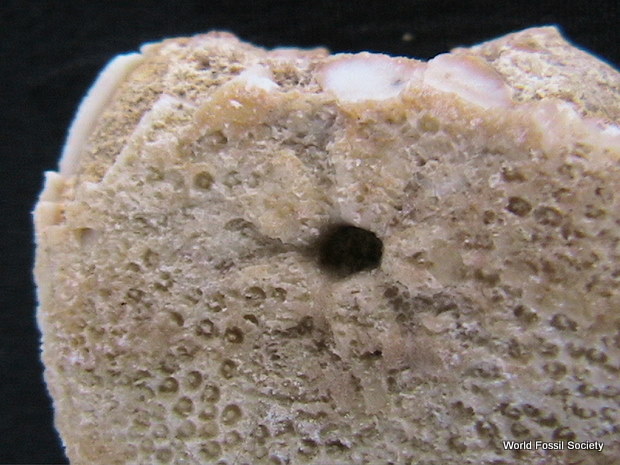
The low oxygen environment affected the growth and number of bivalves, reducing their number and population. Credit: The University of Texas at Austin/Rowan Martindale
The fossils show that before the anoxic event, the Ya Ha Tinda marine community was diverse, and included fish, ichthyosaurs (extinct marine reptiles that looked like dolphins), sea lilies, lobsters, clams and oysters, ammonites, and coleoids (squid-like octopods). During the anoxic event the community collapsed, restructured, and the organisms living in it shrunk. The clams that were most abundant in the community before the anoxic event were completely wiped out and replaced by different species.
The clams that survived during and after the event were much smaller than the clams from before the event, suggesting that low oxygen levels limited their growth.
The sea life recorded at Ya Ha Tinda before and during the anoxic event is similar to fossils found at European sites. Crispin Little, a senior lecturer in paleontology at The University of Leeds who was not involved with the research, said that the similarity between the sites underscores the widespread nature of the anoxic event.
“This confirms previous work suggesting that the T-OAE (anoxic event) was genuinely a global event,” Little said.
However, while other sites were recovering from the anoxic event, the environment at Ya Ha Tinda continued to face stress. Even for small, hardy bivalves, life was tough.
“One of the interesting things about the recovery [at Ya Ha Tinda] is that we actually see fewer individuals at a time when we’re supposed to be seeing community recovery,” Martindale said.
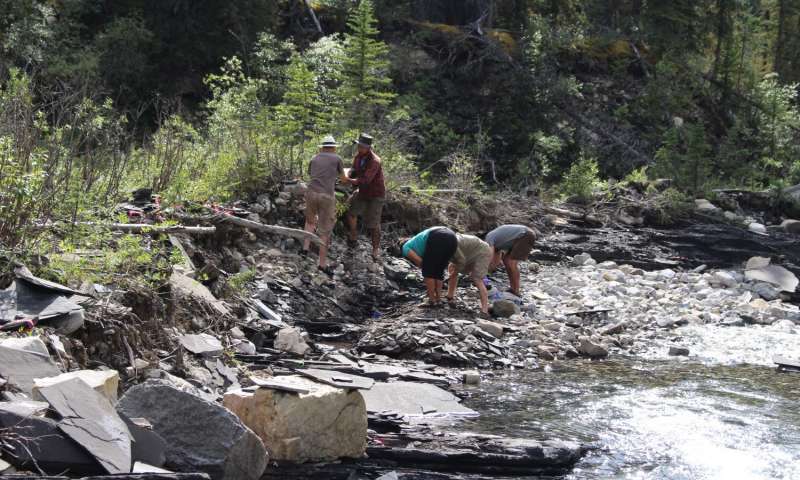
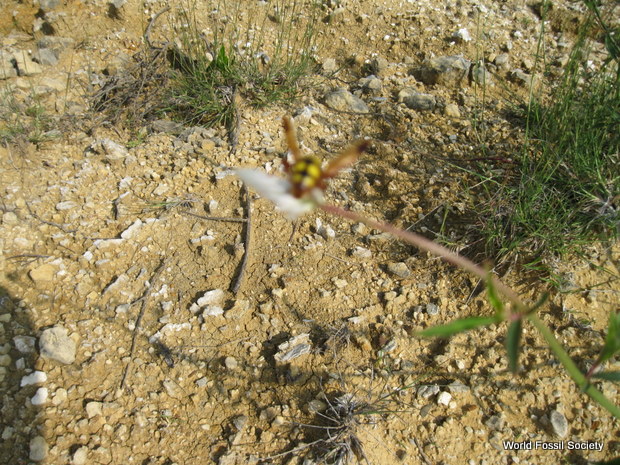
Fieldwork at Ya Ha Tinda Ranch, where the fossils were found. Credit: The University of Texas at Austin/Rowan Martindale
The fossils suggest that the environment was undergoing local stresses that kept oxygen low, Martindale said. More research is needed to untangle why life at Ya Ha Tinda didn’t recover at the same rate as other places.
Since the oceanic anoxic event was a side-effect of climate change, looking back at ancient marine communities could be a window into the potential impacts of ongoing and future climate change, said co-author Martin Aberhan.
“One lesson we can learn from this study is that, on a human time scale, climate-related stresses can have very long-lasting effects, with no signs of recovery for hundred thousands of years, and that the communities before and after a climatic crises can look quite different in composition and ecological functioning,” Aberhan said.
Source :phys.org/news
@ WFS,World Fossil Society,Riffin T Sajeev,Russel T Sajeev
July 10th, 2017
Riffin
@WFS,world Fossil Society,Riffin T Sajeev,Russel T Sajeev
The Pleistocene Epoch is typically defined as the time period that began about 1.8 million years ago and lasted until about 11,700 years ago. The most recent Ice Age occurred then, as glaciers covered huge parts of the planet Earth.
There have been at least five documented major ice ages during the 4.6 billion years since the Earth was formed — and most likely many more before humans came on the scene about 2.3 million years ago.
The Pleistocene Epoch is the first in which Homo sapiens evolved, and by the end of the epoch humans could be found in nearly every part of the planet. The Pleistocene Epoch was the first epoch in the Quaternary Period and the sixth in the Cenozoic Era. It was followed by the current stage, called the Holocene Epoch.
Worldwide ice sheets
At the time of the Pleistocene, the continents had moved to their current positions. At one point during the Ice Age, sheets of ice covered all of Antarctica, large parts of Europe, North America, and South America, and small areas in Asia. In North America they stretched over Greenland and Canada and parts of the northern United States. The remains of glaciers of the Ice Age can still be seen in parts of the world, including Greenland and Antarctica.
But the glaciers did not just sit there. There was a lot of movement over time, and there were about 20 cycles when the glaciers would advance and retreat as they thawed and refroze. Scientists identified the Pleistocene Epoch’s four key stages, or ages — Gelasian, Calabrian, Ionian and Tarantian.
The name Pleistocene is the combination of two Greek words: pleistos (meaning “most”) and kainos (meaning “new” or “recent”). It was first used in 1839 by Sir Charles Lyell, a British geologist and lawyer.
As a result of Lyell’s work, the glacial theory gained acceptance between 1839 and 1846, and scientists came to recognize the existence of ice ages. During this period, British geologist Edward Forbes aligned the period with other known ice ages. In 2009, the International Union of Geological Sciences established the start of the Pleistocene Epoch at 1.806 million years before the present.
Defining an epoch
While scientists haven’t been able to determine the exact causes of an epoch, changes in ocean current, composition of the atmosphere, changes in the position of the Earth in relation to the sun are believed to be key contributors.
Overall, the climate was much colder and drier than it is today. Since most of the water on Earth’s surface was ice, there was little precipitation and rainfall was about half of what it is today. During peak periods with most of the water frozen, global average temperatures were 5 to 10 degrees C (9 to 18 degrees F) below today’s temperature norms.
There were winters and summers during that period. The variation in temperatures produced glacial advances, because the cooler summers didn’t completely melt the snow.
Life during the Ice Age
While Homo sapiens evolved, many vertebrates, especially large mammals, succumbed to the harsh climate conditions of this period.
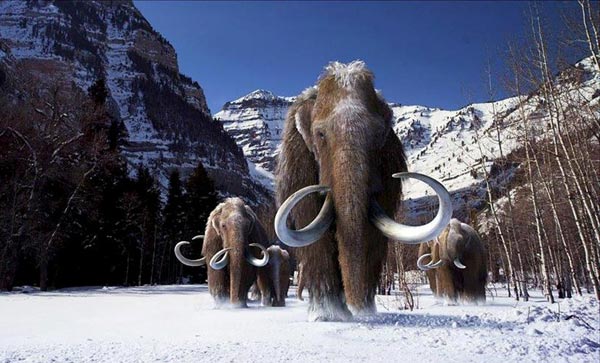
One of the richest sources of information about life in the Pleistocene Epoch can be found in the La Brea Tar Pits in Los Angeles, where remains of everything from insects to plant life to animals were preserved, including a partial skeleton of a female human and a nearly complete woolly mammoth.
In addition to the woolly mammoth, mammals such as saber-toothed cats (Smilodon), giant ground sloths (Megatherium) and mastodons roamed the Earth during this period. Other mammals that thrived during this period include moonrats, tenrecs (hedgehog-like creatures) and macrauchenia (similar to a llamas and camels).
Although many vertebrates became extinct during this period, mammals that are familiar to us today — including apes, cattle, deer, rabbits, kangaroos, wallabies, bears, and members of the canine and feline families — could be found during this time.
Other than a few birds that were classified as dinosaurs, most notably the Titanis, there were no dinosaurs during the Pleistocene Epoch. They had become extinct at the end of the Cretaceous Period, more than 60 million years before the Pleistocene Epoch began.
Birds flourished during this period, including members of the duck, geese, hawk and eagle families. There were also some flightless birds such as ostriches, rheas and moas. The flightless birds did not fare as well, as they had to compete with mammals and other creatures for limited supplies of food and water, as a good portion of the water was frozen.
Crocodiles, lizards, turtles, pythons and other reptiles also thrived during this period.
As for vegetation, it was fairly limited in many areas. There were some scattered conifers, including pines, cypress and yews, along with some broadleaf trees such as beeches and oaks. On the ground, there were prairie grasses as well as members of the lilly, orchid and rose families.
Mass extinction
About 13,000 years ago, more than three-fourths of the large Ice Age animals, including woolly mammoths, mastodons, saber-toothed tigers and giant bears, died out. Scientists have debated for years over the cause of the extinction, with both of the major hypotheses — human overhunting and climate change — insufficient to account for the mega die-off.
Recent research suggests that an extraterrestrial object, possibly a comet, about 3 miles wide, may have exploded over southern Canada, nearly wiping out an ancient Stone Age culture as well as megafauna like mastodons and mammoths.
Source: Livescience
@WFS,world Fossil Society,Riffin T Sajeev,Russel T Sajeev