It’s true—some rocks can float on water for years at a time. And now scientists know how they do it, and what causes them to eventually sink.
X-ray studies at the Department of Energy’s Lawrence Berkeley National Laboratory (Berkeley Lab) have helped scientists to solve this mystery by scanning inside samples of lightweight, glassy, and porous volcanic rocks known as pumice stones. The X-ray experiments were performed at Berkeley Lab’s Advanced Light Source (ALS), an X-ray source known as a synchrotron.
The surprisingly long-lived buoyancy of these rocks—which can form miles-long debris patches on the ocean known as pumice rafts that can travel for thousands of miles—can help scientists discover underwater volcano eruptions.
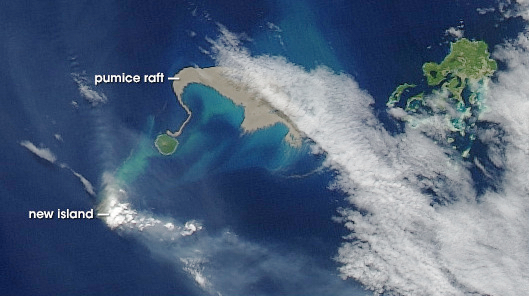
In this 2006 satellite image, a large “raft” of floating pumice stones (beige) appears following a volcanic eruption in the Tonga Islands. (Credit: Jesse Alan/NASA Earth Observatory, Goddard Space Flight Center)
And, beyond that, learning about its flotation can help us understand how it spreads species around the planet; pumice is nutrient rich and readily serves as a seafaring carrier of plant life and other organisms. Floating pumice can also be a hazard for boats, as the ashy mixture of ground-up pumice can clog engines.
“The question of floating pumice has been around the literature for a long time, and it hadn’t been resolved,” said Kristen E. Fauria, a UC Berkeley graduate student who led the study, published in Earth and Planetary Science Letters.
While scientists have known that pumice can float because of pockets of gas in its pores, it was unknown how those gases remain trapped inside the pumice for prolonged periods. If you soak up enough water in a sponge, for example, it will sink.
“It was originally thought that the pumice’s porosity is essentially sealed,” Fauria said, like a corked bottle floating in the sea. But pumice’s pores are actually largely open and connected—more like an uncorked bottle. “If you leave the cap off and it still floats … what’s going on?”
Some pumice stones have even been observed to “bob” in the laboratory—sinking during the evening and surfacing during the day.
To understand what’s at work in these rocks, the team used wax to coat bits of water-exposed pumice sampled from Medicine Lake Volcano near Mount Shasta in Northern California and Santa María Volcano in Guatemala.
They then used an X-ray imaging technique at the ALS known as microtomography to study concentrations of water and gas—in detail measured in microns, or thousandths of a millimeter—within preheated and room-temperature pumice samples.
The detailed 3-D images produced by the technique are very data-intensive, which posed a challenge in quickly identifying the concentrations of gas and water present in the pumice samples’ pores.
To tackle this problem, Zihan Wei, a visiting undergraduate researcher from Peking University, used a data-analysis software tool that incorporates machine learning to automatically identify the gas and water components in the images.
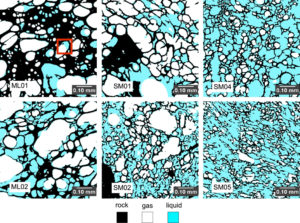
Concentrations of liquid and gas in samples of pumice stones are labeled in these images, produced by X-ray microtomography at Berkeley Lab’s Advanced Light Source. The images assisted researchers in identifying the mechanisms that enable pumice to float for prolonged periods. Heated pumice (shown in images at the top right and bottom right) samples contain a smaller volume of trapped gas than room-temperature samples. (Credit: UC Berkeley, Berkeley Lab)
Researchers found that the gas-trapping processes that are in play in the pumice stones relates to “surface tension,” a chemical interaction between the water’s surface and the air above it that acts like a thin skin—this allows some creatures, including insects and lizards, to actually walk on water.
“The process that’s controlling this floating happens on the scale of human hair,” Fauria said. “Many of the pores are really, really small, like thin straws all wound up together. So surface tension really dominates.”
The team also found that a mathematical formulation known as percolation theory, which helps to understand how a liquid enters a porous material, provides a good fit for the gas-trapping process in pumice. And gas diffusion—which describes how gas molecules seek areas of lower concentration—explains the eventual loss of these gases that causes the stones to sink.
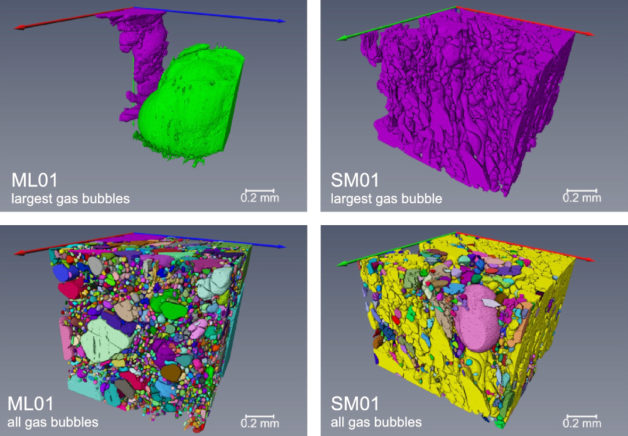
Individual gas bubbles trapped in two pumice samples (labeled “ML01” and “SM01”) are shaded with different colors. The size and connectedness of the bubbles can vary widely within a sample. (Credit: UC Berkeley, Berkeley Lab)
Michael Manga, a staff scientist in Berkeley Lab’s Energy Geosciences Division and a professor in the Department of Earth and Planetary Science at UC Berkeley who participated in the study, said, “There are two different processes: one that lets pumice float and one that makes it sink,” and the X-ray studies helped to quantify these processes for the first time. The study showed that previous estimates for flotation time were in some cases off by several orders of magnitude.
“Kristen had the idea that in hindsight is obvious,” Manga said, “that water is filling up only some of the pore space.” The water surrounds and traps gases in the pumice, forming bubbles that make the stones buoyant. Surface tension serves to keep these bubbles locked inside for prolonged periods. The bobbing observed in laboratory experiments of pumice floatation is explained by trapped gas expanding during the heat of day, which causes the stones to temporarily float until the temperature drops.
The X-ray work at the ALS, coupled with studies of small pieces of pumice floating in water in Manga’s UC Berkeley lab, helped researchers to develop a formula for predicting how long a pumice stone will typically float based on its size. Manga has also used an X-ray technique at the ALS called microdiffraction, which is useful for studying the origins of crystals in volcanic rocks.
Dula Parkinson, a research scientist at Berkeley Lab’s ALS who assisted with the team’s microtomography experiments, said, “I’m always amazed at how much information Michael Manga and his collaborators are able to extract from the images they collect at ALS, and how they’re able to join that information with other pieces to solve really complicated puzzles.”
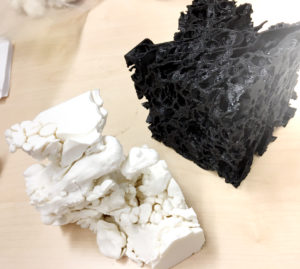
These 3-D printed models show a magnified sample of pumice (black) and a large concentration of gas (white) filling interconnected pores within that pumice sample. (Credit: Berkeley Lab)
The recent study triggered more questions about floating pumice, Fauria said, such as how pumice, ejected from deep underwater volcanoes, finds its way to the surface. Her research team has also conducted X-ray experiments at the ALS to study samples from so-called “giant” pumice that measured more than a meter long.
That stone was recovered from the sea floor in the area of an active underwater volcano by a 2015 research expedition that Fauria and Manga participated in. The expedition, to a site hundreds of miles north of New Zealand, was co-led by Rebecca Carey, a scientist formerly affiliated with the Lab’s ALS.
Underwater volcano eruptions are not as easy to track down as eruptions on land, and floating pumice spotted by a passenger on a commercial aircraft actually helped researchers track down the source of a major underwater eruption that occurred in 2012 and motivated the research expedition. Pumice stones spewed from underwater volcano eruptions vary widely in size but can typically be about the size of an apple, while pumice stones from volcanoes on land tend to be smaller than a golf ball.
“We’re trying to understand how this giant pumice rock was made,” Manga said. “We don’t understand well how submarine eruptions work. This volcano erupted completely different than we hypothesized. Our hope is that we can use this one example to understand the process.”
Fauria agreed that there is much to learn from underwater volcano studies, and she noted that X-ray studies at the ALS will play an ongoing role in her team’s work.
The Advanced Light Source is a DOE Office of Science User Facility. This work was supported by the U.S. National Science Foundation.


 June 6th, 2017
  Riffin