 January 11th, 2014
  Riffin
 Today in Australia they call it Kauri, in Asia they call it Dammar, and in South America it does not exist at all unless planted there. But 52 million years ago the giant coniferous evergreen tree known to botanists as Agathis thrived in the Patagonian region of Argentina, according to an international team of paleobotanists, who have found numerous fossilized remains there.
“These spectacular fossils reveal that Agathis is old and had a huge range that no one knew about — from Australia to South America across Antarctica,” said Peter Wilf, professor of geoscience, Penn State.
Agathis trees currently grow thousands of miles from Argentina, ranging from Sumatra to New Zealand. They often prefer mountain rainforests, where it is wet and warm all year round. They can grow as tall as 200 feet, but are usually between 130 and 150 feet at maturity. Economically, they are prized and heavily cut for their soft, workable wood. In the past, the Agathis resin, known as manila copal, was exploited for linoleum and varnishes, but synthetics replaced most of that use.
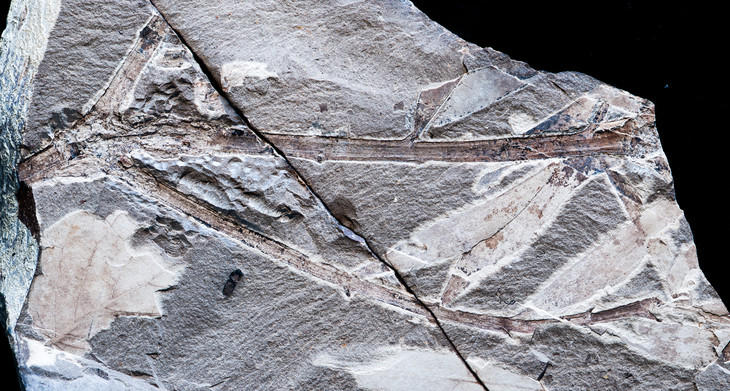
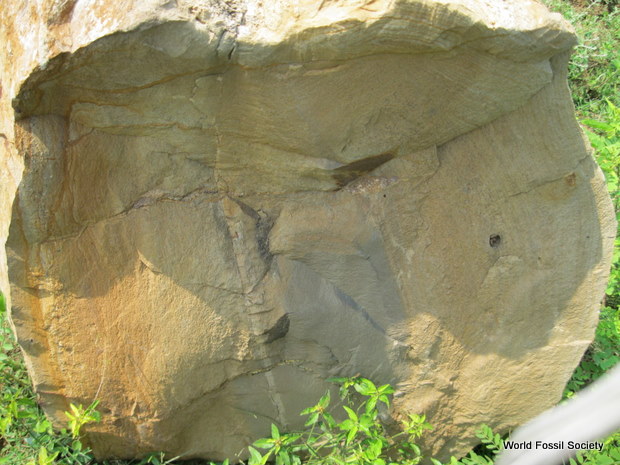
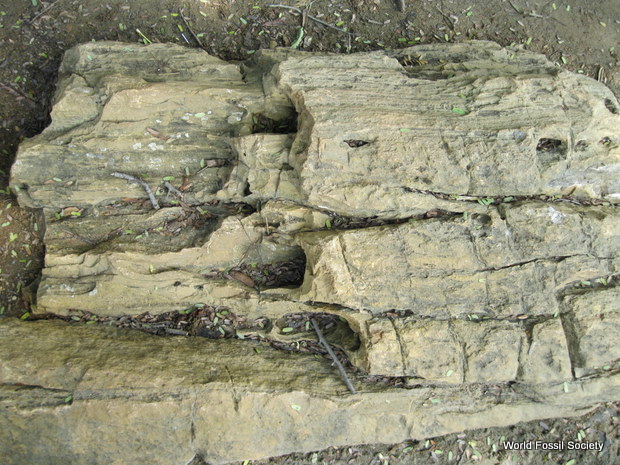
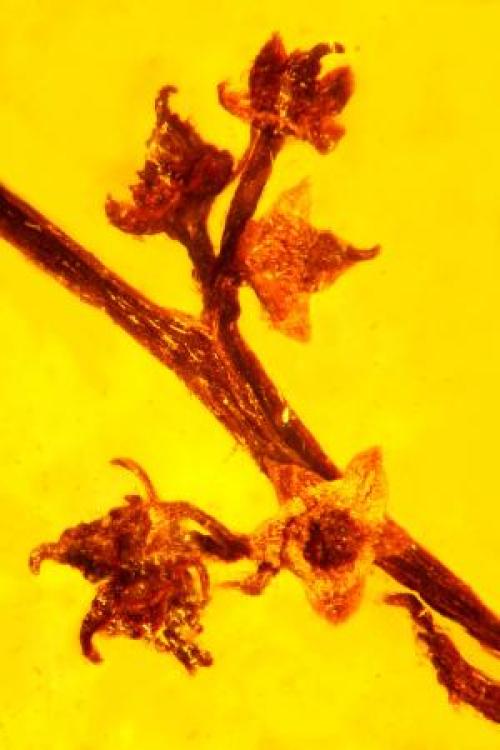
Fossil of leafy Agathis tree branch. (Credit: Peter Wilf/Penn State)
The researchers report in the current issue of American Journal of Botany that “Agathis was a dominant, keystone element of the Patagonian Eocene floras, alongside numerous other plant taxa that still associate with it in Australasia and Southeast Asia.”
“There is a fossil record of Agathis in Australia and New Zealand, where it still lives,” said Wilf. “However, Agathis fossils have never been found anywhere else until now, and they have never been as complete as these.”
Wilf and his colleagues work at two sites in Patagonia, Argentina: Laguna del Hunco that dates to the early Eocene at about 52.2 million years ago, and Río Pichileufú dating to about 47.7 million years ago.
“These sites were discovered in the 1920s and 1930s, but the remoteness of the locations and the hardness of the rock are why they hadn’t been investigated in detail before we started in 1999,” said Wilf. “Now, with modern amenities — satellite phones for example — and especially the presence of our partner institution, the Egidio Feruglio Museum, in the same region as the dig sites, recovering these fossils becomes much easier.”
Agathis grew in Patagonia when South America was part of the remainder of the southern supercontinent of Gondwana, composed of South America, Antarctica and Australia. Much earlier, India, Madagascar, New Zealand and Africa separated and moved north, but around the time of these fossils, South America was just beginning to part from Antarctica, which was not ice covered at the time.
“Agathis probably existed in all three areas, Australia, Antarctica and South America, at that time,” said Wilf. “Climate change in Antarctica — the cold and ice — killed them there, and a change to seasonal dryness in southern South America put an end to them in Patagonia.”
Subsequently, the trees, which are wind dispersed, moved away from the cooling south, and some left northward-moving Australia for southeast Asia, where they thrive except for human interference, but they no longer grow in cold, often dry, Patagonia.
Wilf ‘s team recovered not only leaves, but also numerous branches, pollen cones, seed cones and even a winged seed still attached to the cone. The various species of Agathis are usually identified by their pollen cones, so this is the first time that a fossil Agathis could be directly compared to trees growing today.
“We also went to Borneo and studied the most similar living relative of the fossil Agathis, a threatened species there,” said Wilf. “We collected DNA samples to better understand the fossil-modern relationship.”
According to the researchers, the Argentinian fossil Agathis clearly belongs to the same natural group as those living today up to almost 10,000 miles away in the tropical West Pacific.
“Agathis is a very dramatic example of survival via huge range shifts, from the far south to the tropics, in response to climate change and land movement over millions of years,” said Wilf. “It is not clear that Agathis can adapt to the severely more rapid human-induced pressures it is experiencing now from deforestation, selective logging and climate change.”
Also working on this research are Ignacio H. Escapa and Rubén Cúneo, Consejo Nacional de Investigaciones Científicas y Técnicas and Museo Paleontológico Egidio Feruglio, Chubut, Argentina; Robert M. Kooyman, National Herbarium of New South Wales, Sydney; Kirk R. Johnson, Smithsonian Institution; and Ari Iglesias, Consejo Nacional de Investigaciones Científicas y Técnicas and División Palontología, Universidad Nacional del Comahue, Río Negro, Argentina.
The National Science Foundation, the David and Lucile Packard Foundation, National Geographic Society,University of Pennsylvania Research Foundation and the Andrew W. Mellon Foundation supported this work.


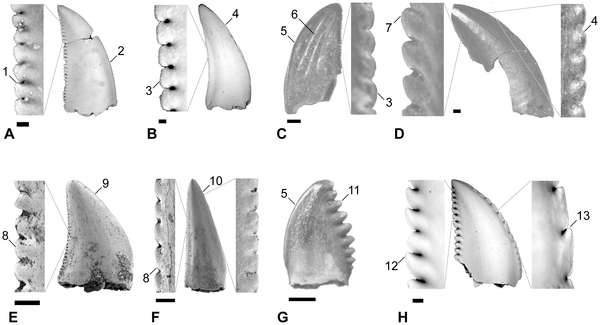
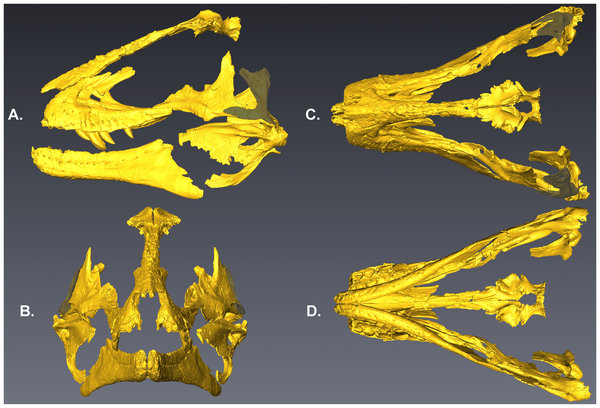
![Summary of quantitative morphotypes showing their stratigraphic ages. show more Each tooth icon likely represents a distinct taxon with the indicated known range based on formation as observed in this study. A, Lancian Saurornitholestinae gen. et sp., UCMP 187036 (reversed); B, Pectinodon bakkeri; C, Lancian cf. Richardoestesia gilmorei, UCMP 120255 (reversed); D, Lancian cf. Richardoestesia isosceles, UCMP 187175 (reversed); E, Atrociraptor marshalli, TMP 2000.045.0035; F, Horseshoe Canyon Dromaeosaurinae gen. et sp., TMP 1999.050.0116 (reversed); G, Horseshoe Canyon cf. Troodon sp., TMP 2000.045.0024 (reversed); H, Horseshoe Canyon cf. R. gilmorei, TMP 2003.015.0002; I, Saurornitholestes langstoni, TMP 1995.147.0026; J, Bambiraptor feinbergi, AMNH FR 30556; K, Dromaeosaurus albertensis, TMP 1986.130.0211; L, Zapsalis abradens, TMP 1987.050.0008; M, Troodon formosus, TMP 1995.147.0025; N, Dinosaur Park cf. Pectinodon sp., TMP 2000.021.0001; O, Richardoestesa gilmorei, TMP 2000.019.0004; P, Oldman cf. R. gilmorei, 1987.080.0035; Q, Richardoestesia isosceles, LSUMGS 489∶6238 (reversed); R, Milk River Saurornitholestinae gen. et sp., UALVP 50531 (reversed); S, Milk River Dromaeosauridae gen. et sp., UALVP 48365 (reversed); T, Milk River Dromaeosaurinae gen. et sp., UALVP 49571; U, Milk River cf. Zapsalis sp., UALVP 49582; V, Aquilan cf. Richardoestesia gilmorei, UALVP 48157 (reversed); and W, Aquilan cf. Richardoestesia isosceles, UALVP 48279 (reversed). B modified from Longrich (2008); H modified from Larson et al. (2010); J modified from Burnham (2004); P modified from Sankey et al. (2002); Q modified from Sankey (2001); R–W modified from Larson (2008). Teeth scaled to matching FABL. [full page width]. doi:10.1371/journal.pone.0054329.g006](http://worldfossilsociety.org/wp-content/uploads/2013/12/131029133124-large11.png)
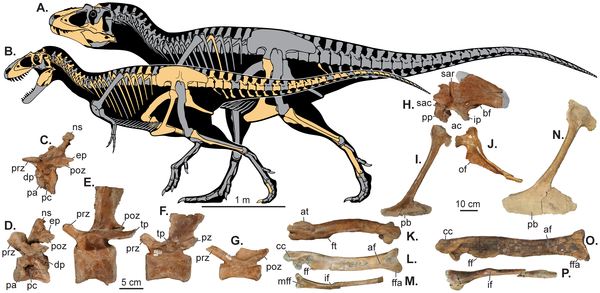
![Sea level change and the hypothesized evolutionary diversification of Tyrannosauroidea. show more Sea level indicators include: (A) Time-calibrated phylogenetic relationships and paleobiogeographic distribution of tyrannosaurids with biogeographic origin indicated by color (see Methods and File S1 for details of analyses and the stratigraphic and phylogenetic relationships of tyrannosauroids within theropod dinosaurs). (B) Late Cretaceous regional transgression-regression cycles on Laramidia (brown [31]); global sea-level fluctuations (blue [34], [35]); and areal extent of Laramidia at minimum (alluvial plain) and maximum (alluvial plain and coastal plain) sea levels (green [1]). doi:10.1371/journal.pone.0079420.g004](http://worldfossilsociety.org/wp-content/uploads/2013/12/131029133124-large7.png)