 January 4th, 2014
  Riffin
 The holotype and only specimen of the chasmosaurine ceratopsid dinosaur ‘Nedoceratops hatcheri’ has been the source of considerable taxonomic debate since its initial description. At times it has been referred to its own genus while at others it has been considered synonymous with the contemporaneous chasmosaurine Triceratops. Most recently, the debate has focused on whether the specimen represents an intermediate ontogenetic stage between typical young adult Triceratops and the proposed mature morphology, which was previously considered to represent a distinct genus, ‘Torosaurus’.
Methodology/Principal Findings
The only specimen of ‘Nedoceratops hatcheri’ was examined and the proposed diagnostic features of this taxon were compared with other chasmosaurine ceratopsids. Every suggested autapomorphy of ‘Nedoceratops’ is found in specimens of Triceratops. In this study, Triceratops includes the adult ‘Torosaurus’ morphology. The small parietal fenestra and elongate squamosals of Nedoceratops are consistent with a transition from a short, solid parietal-squamosal frill to an expanded, fenestrated condition. Objections to this hypothesis regarding the number of epiossifications of the frill and alternations of bone surface texture were explored through a combination of comparative osteology and osteohistology. The synonymy of the three taxa was further supported by these investigations.
Conclusions/Significance
The Triceratops, ‘Torosaurus’, and ‘Nedoceratops’ morphologies represent ontogenetic variation within a single genus of chasmosaurine: Triceratops. This study highlights how interpretations of dinosaur paleobiology, biodiversity, and systematics may be affected by ascribing ontogenetic and other intraspecific variation a taxonomic significance.

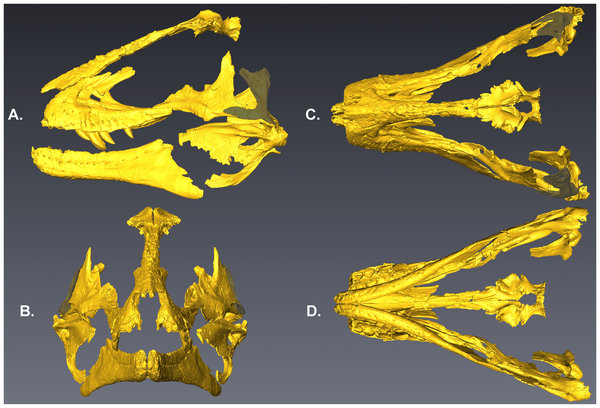
Figure 1. USNM 2412, the holotype and only specimen of ‘Nedoceratops hatcheri’.A. Left lateral view. B. Right lateral view. Scale bars equal 10 cm.
doi:10.1371/journal.pone.0028705.g001
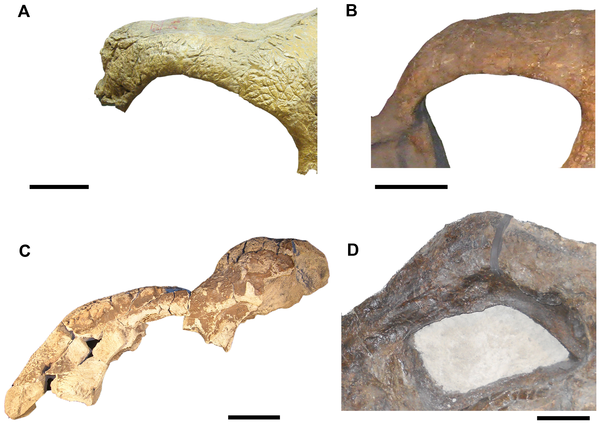
Figure 2. Nasal horn variation in Triceratops.
A. USNM 4720, originally named the holotype of Triceratops ‘obtusus.’ This specimen preserves a very low, blunt nasal horn. B. USNM 2412, the holotype of ‘Nedoceratops hatcheri.’ The nasal horn of this specimen (if present – see discussion) is a low, smooth boss. C. UCMP 128561, originally named the holotype of ‘Ugrosaurus olsoni.’ The nasal horn of this specimen is a low rugose boss. D. MOR 981 (previously ‘Torosaurus’). This specimen bears a low boss which is undifferentiated from the nasals. Scale bars equal 10 cm.
doi:10.1371/journal.pone.0028705.g002
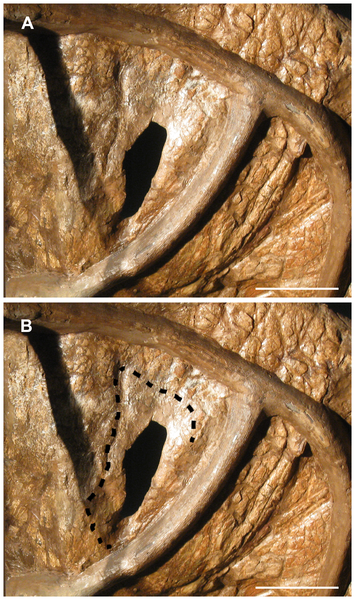
Figure 3. Ventral view of the right half of the parietal of USNM 2412.
A. When viewed with offset lighting, the rim of a shallow depression surrounding the small fenestra is apparent. B. Extent of the depression is outlined. The area within the outline is markedly thinner than the remainder of the parietal. The extent of the depression is partially obscured by the framework which supports the skull. Scale bars equal 10 cm.
doi:10.1371/journal.pone.0028705.g003
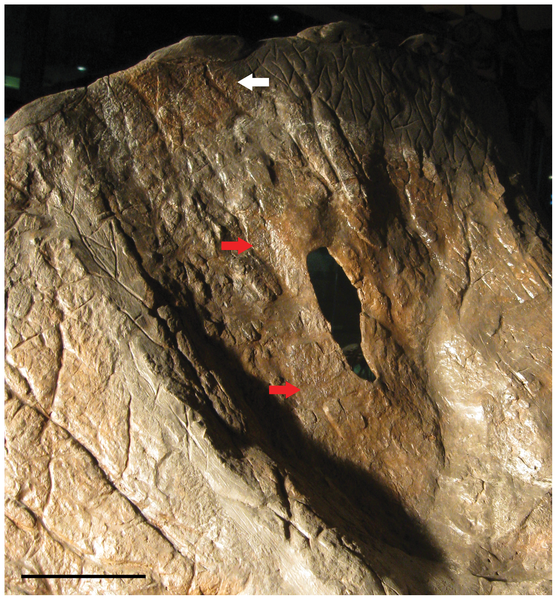
Figure 4. Dorsal view of the parietal fenestra of USNM 2412.
Although much of the parietal is obscured by reconstruction, a transition in surface texture from the posterior margin (white arrow) to the area immediately adjacent to and surrounding the fenestra (red arrows) is apparent. Scale bar equals 10 cm.
doi:10.1371/journal.pone.0028705.g004
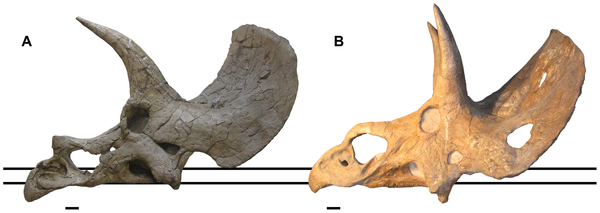
Figure 5. Lateral views of USNM 1201 and USNM 2142.
A. Left lateral view of USNM 1201, originally named the holotype of Triceratops ‘elatus.’ Note that the ventral extremity of the squamosal (denoted by upper horizontal line) is positioned well above the alveolar process of the maxilla (denoted by lower horizontal line). B. USNM 2412, right lateral view (reversed for direct comparison with USNM 1201 which only preserves the left side of the skull; the right squamosal of USNM 2412 is more elevated than the left). The alveolar process of the maxilla is positioned on the lower horizontal line, allowing for a direct comparison with USNM 1201. Note that the squamosal is not elevated to the extent found in USNM 1201. The position of the ventral extremity above the alveolar process of the maxilla can thus not be used to distinguish ‘Nedoceratops hatcheri’ from Triceratops. Scale bars equal 10 cm.
doi:10.1371/journal.pone.0028705.g005
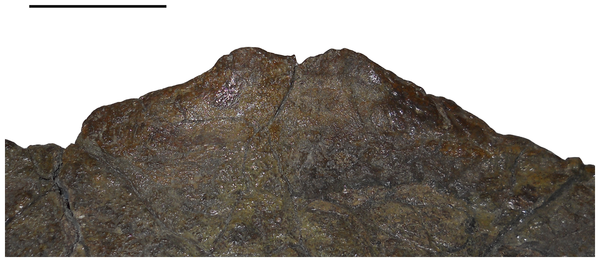
Figure 6. Episquamosal of MOR 2975.
The presence of two peaks is suggestive of midline erosion. Scale bar equals 5 cm.
doi:10.1371/journal.pone.0028705.g006
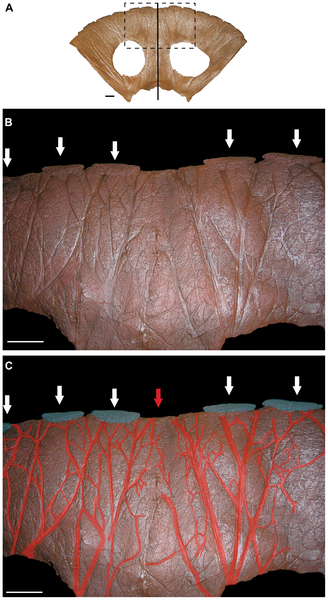
Figure 7. Ventral view of the parietal of MOR 1122.
A. The entire parietal with midline denoted by vertical line. Dashed rectangle indicates area of interest in B and C. B. Impressed vascular traces are found over the entire ventral surface of the parietal. Epiparietals are indicated by arrows. MOR 1122 does not appear to possess an epiparietal over the midline of the parietal. C. Major vascular traces are highlighted in red. Note that the most prominent vascular traces lead to the epiparietals (highlighted in blue). Two large vascular traces lead to the midline of the parietal (denoted by red arrow), suggesting that an epiparietal occupied this position but was lost taphonomically. Scale bars equal 10 cm.
doi:10.1371/journal.pone.0028705.g007
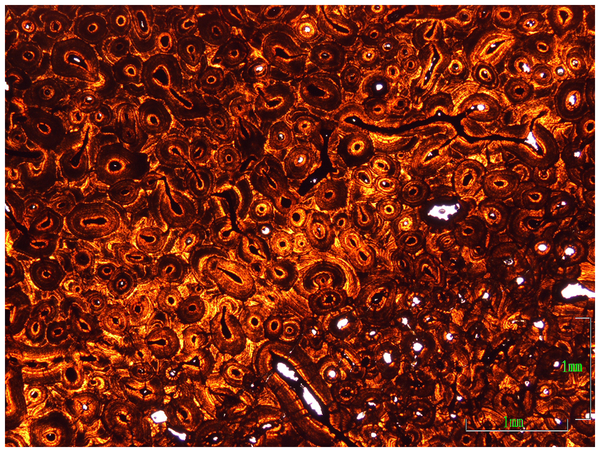
Figure 8. Osteohistology of the postorbital horn core of MOR 981.
The dense, multigenerational ‘Haversian’ tissue is indicative of a mature individual.
doi:10.1371/journal.pone.0028705.g008
Citation: Scannella JB, Horner JR (2011) ‘Nedoceratops’: An Example of a Transitional Morphology. PLoS ONE 6(12): e28705. doi:10.1371/journal.pone.0028705
Editor: Leon Claessens, College of the Holy Cross, United States of America


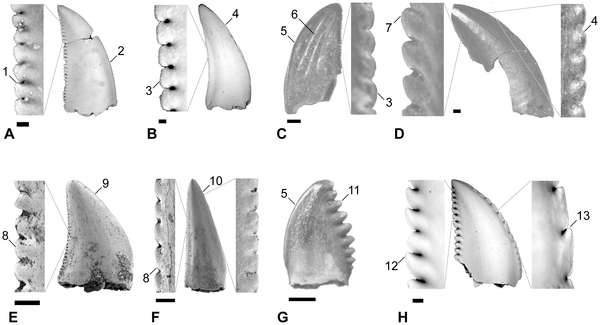
![Summary of quantitative morphotypes showing their stratigraphic ages. show more Each tooth icon likely represents a distinct taxon with the indicated known range based on formation as observed in this study. A, Lancian Saurornitholestinae gen. et sp., UCMP 187036 (reversed); B, Pectinodon bakkeri; C, Lancian cf. Richardoestesia gilmorei, UCMP 120255 (reversed); D, Lancian cf. Richardoestesia isosceles, UCMP 187175 (reversed); E, Atrociraptor marshalli, TMP 2000.045.0035; F, Horseshoe Canyon Dromaeosaurinae gen. et sp., TMP 1999.050.0116 (reversed); G, Horseshoe Canyon cf. Troodon sp., TMP 2000.045.0024 (reversed); H, Horseshoe Canyon cf. R. gilmorei, TMP 2003.015.0002; I, Saurornitholestes langstoni, TMP 1995.147.0026; J, Bambiraptor feinbergi, AMNH FR 30556; K, Dromaeosaurus albertensis, TMP 1986.130.0211; L, Zapsalis abradens, TMP 1987.050.0008; M, Troodon formosus, TMP 1995.147.0025; N, Dinosaur Park cf. Pectinodon sp., TMP 2000.021.0001; O, Richardoestesa gilmorei, TMP 2000.019.0004; P, Oldman cf. R. gilmorei, 1987.080.0035; Q, Richardoestesia isosceles, LSUMGS 489∶6238 (reversed); R, Milk River Saurornitholestinae gen. et sp., UALVP 50531 (reversed); S, Milk River Dromaeosauridae gen. et sp., UALVP 48365 (reversed); T, Milk River Dromaeosaurinae gen. et sp., UALVP 49571; U, Milk River cf. Zapsalis sp., UALVP 49582; V, Aquilan cf. Richardoestesia gilmorei, UALVP 48157 (reversed); and W, Aquilan cf. Richardoestesia isosceles, UALVP 48279 (reversed). B modified from Longrich (2008); H modified from Larson et al. (2010); J modified from Burnham (2004); P modified from Sankey et al. (2002); Q modified from Sankey (2001); R–W modified from Larson (2008). Teeth scaled to matching FABL. [full page width]. doi:10.1371/journal.pone.0054329.g006](http://worldfossilsociety.org/wp-content/uploads/2013/12/131029133124-large11.png)
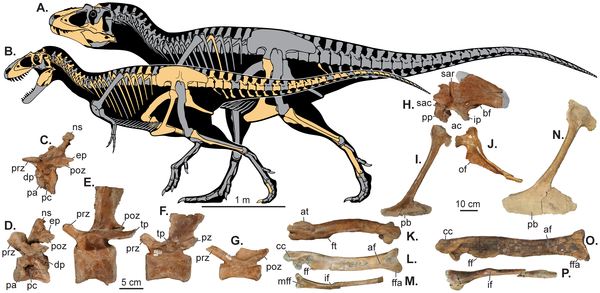
![Sea level change and the hypothesized evolutionary diversification of Tyrannosauroidea. show more Sea level indicators include: (A) Time-calibrated phylogenetic relationships and paleobiogeographic distribution of tyrannosaurids with biogeographic origin indicated by color (see Methods and File S1 for details of analyses and the stratigraphic and phylogenetic relationships of tyrannosauroids within theropod dinosaurs). (B) Late Cretaceous regional transgression-regression cycles on Laramidia (brown [31]); global sea-level fluctuations (blue [34], [35]); and areal extent of Laramidia at minimum (alluvial plain) and maximum (alluvial plain and coastal plain) sea levels (green [1]). doi:10.1371/journal.pone.0079420.g004](http://worldfossilsociety.org/wp-content/uploads/2013/12/131029133124-large7.png)